A Day in STAT 216: Statistics I

What does the distribution of the years found on pennies look like? What does the distribution of the mean year of a sample of pennies look like? The famous jar of pennies makes its appearance every semester in STAT 216: Statistics I to help students answer this question. This semester was no different.

A jar full of pennies

In Prof. Kang‘s class, students sampled pennies from the jar to try to get some intuition about the distribution of dates. What is a typical year for a penny? How much variability is there?

Follow bucknell.math.stat on Instagram!

Students plotted the distribution of the years on their random sample of 25 pennies either using technology (left) or physically by making a histogram of pennies (right). Want a refresher on what a histogram is? Check out this interactive visualization that shows how they are built.

Th penny activity all leads up to learning about one of the most important concepts of the class, the sampling distribution. This is a distribution of a sample statistic (summary of a sample) across multiple samples of the same size. Here we want to know what the distribution of the *mean* year of pennies is for a sample of size 25 (below, left). How does that change if we take smaller samples of size 5 (below, right)?

To visualize the sampling distribution, students create post-it note histograms on the board. Each post-it note has one student’s sample statistic (mean year of their sample of pennies).

What do you notice about the center of both of these sampling distribution? What about the variability? What about the shape? The answers to these questions involve the Central Limit Theorem, another big concept of the course. Students who continue on in statistics and mathematical economics get to prove the Central Limit Theorem later on in their course work (shout out STAT 304: Statistical Inference Theory).

Many sections of Stat I are offered every year, and the class serves students across campus. It is a required class for majors in accounting & finance (or they can take Calculus I), business analytics, biology, economics, mathematical economics, and statistics and is an option for majors in animal behavior, geosciences, and psychology.

The instruction approach for this class follows the American Statistical Association’s Guidelines for Assessment and Instruction in Statistics Education (GAISE guidelines). We emphasize the importance of communicating findings precisely yet accessibility, and use technology to tackle real-world datasets. This class is also a part of Bucknell’s writing across the curriculum program as a writing in the discipline class. Throughout the semester students work both individually and in teams on drafting and revising reports that answer statistical questions on real data.

Connect to Department of Mathematics and Statistics at Bucknell University on LinkedIn.

Are you an alum who took 216? We’d love to hear about what that experience was like for you, so reach out on LinkedIn! Want a chance to be featured in a future blog post? Respond to our question of the week here, and your answer may be chosen for a future post.

A Day in Math 358: Topics in Operations Research

Operations Research (OR) is often referred to as “the science of decision making.” Applications of OR span all domains, from scheduling Major League Baseball games to planning the modernization of airline fleets; from designing the optimal configuration of lines at Disney World attractions to assigning nurses to patients in emergency rooms; from streamlining factory floor operations to optimizing large-scale transportation logistics.

One unit of MATH 358: Topics in Operations Research is devoted to studying Markov Chain models.

Markov chains allow us to study and predict the long-term behavior of systems that evolve over time in uncertain ways. Popular applications include queueing systems, inventory management, and animal migration patterns. Perhaps the most famous Markov chain model is Google’s PageRank algorithm, which is used to help determine which web pages appear at the top of a Google search.

Many board games, including Monopoly, Chutes and Ladders, and Hi-Ho Cherry-O, can be analyzed using Markov chain models. MATH 358 students, taught by Prof. Lucas Waddell this semester, first warmed up by reviewing the math behind the game of Craps (also a Markov chain). They rolled some dice and kept track of their wins and losses.

Top left: Prof. Waddell in front of the class

Top middle: Bret Cozby (’28, Mathematical Economics major) and Olivia Seward (’26, Mathematical Economics major)

Top right: Michael Amante (’27, Mathematical Economics major and Italian Studies major), Will Lindquist (’27, Statistics major), and Kerry O’Day (’28, Mathematical Economics major)

Bottom first row: Skyler Le (’27, Mathematics major), Roger Chen (’28, Applied Mathematics major), Cornelius Nichilo (’27, Mathematical Economics major), Zach Selfon (’27, Mathematical Economics major)

Bottom second row: Samuel Berry (’27, Applied Mathematics major), Reed Nester (’27, Mathematical Economics major)

Follow bucknell.math.stat on Instagram!

To get some more hands-on experience with Markov chain modeling, the students went on to investigate the classic game, Cootie. In the game Cootie, players race to construct a Cootie bug, which consists of a head, body, one eye piece, one tongue/teeth/lips, one antennae/hat/bow, and six legs. The order in which pieces get added to the partially completed Cootie bug is randomly determined by the roll of a die.

Top right: Skyler Le (’27, Mathematics major), Kerry O’Day (’28, Mathematical Economics major)

Bottom left: Bret Cozby (’28, Mathematical Economics major), Roger Chen (’28, Applied Mathematics major), John Rich (’27, Computer Science and Engineering Major)

Bottom right: John Occhipinti (’27, Mathematical Economics Major), Samuel Berry (’27, Applied Mathematics major), Zach Selfon (’27, Mathematical Economics major)

Students were tasked to play a game of Cootie, and then use their intuition about probability to guess the expected number of turns it would take to somebody to completely construct the Cootie bug. 

After guessing, students created a Markov chain model of the game. This required them to determine that there are 30 unique states that the Cootie bug can be in on its journey from the beginning of the game to the end, and to calculate transition probabilities between these states. For example, if the Cootie bug currently has just a body and a head, there is a 1/6 probability that after the next turn, the Cootie bug will have a body, a head, and one leg.

The students were then able to calculate that the expected number of turns in a game of Cootie is (spoiler warning) 48.2694 turns.

A homework assignment asked them to think about how the model would change if the game was played with a weighted die. Another spoiler warning… it changes significantly.

Connect to Department of Mathematics and Statistics at Bucknell University on LinkedIn.

Are you an alum who took 358? We’d love to hear about what that experience was like for you, so reach out on LinkedIn! Want a chance to be featured in a future blog post? Respond to our question of the week here, and your answer may be chosen for a future post.

A day in MATH 208: Mathematical Explorations

Math 208: Mathematical Explorations is a half credit class for intended Math/Statistics/Applied Math/Mathematical Economics majors. In this class, students:

  • Investigate a wide-range of math ideas beyond intro calculus and statistics
  • Build community and work closely with the other first-year majors 
  • Get involved with the math & stat department

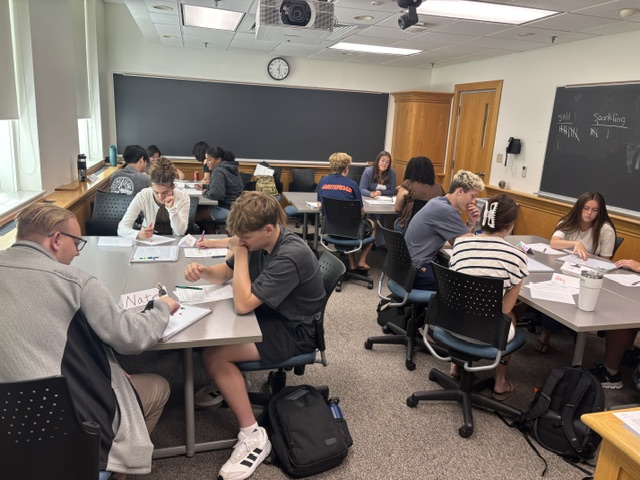
This semester, Prof. Kelly Bickel is teaching the class. Most class days involve hands-on activities where students explore math-related ideas in groups. On Wednesday August 26th, the topic of class was Mathematical Games- games whose rules are governed by mathematical principles. If you have such a game, some natural questions are:

  1. If it’s a one-player game, when is it winnable?
  2. If it’s a two-player game, what’s the best strategy for each player?
  3. Does either player have a winning strategy?

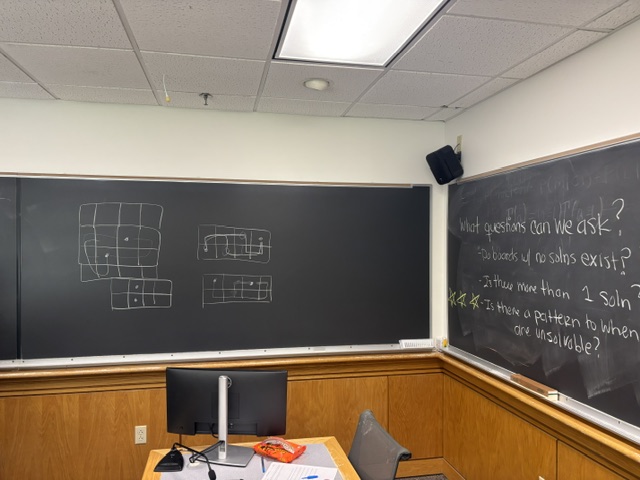
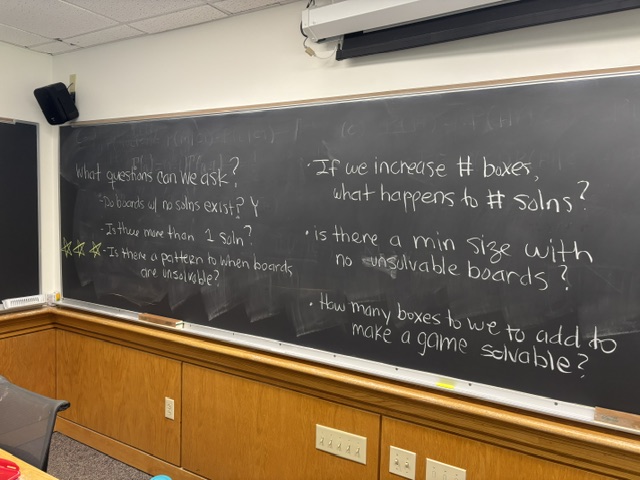
During class, students played some mathematical games and tried to answer those questions. First they looked at grids of different sizes with two dots marking two grid cells. Is there a path between the two dots that goes through each grid cell exactly once? Once students played a few boards, they were then asked to come up with more general questions about these grid games. One question in particular was popular: is there a pattern to when boards are unsolvable?

Follow bucknell.math.stat on Instagram!

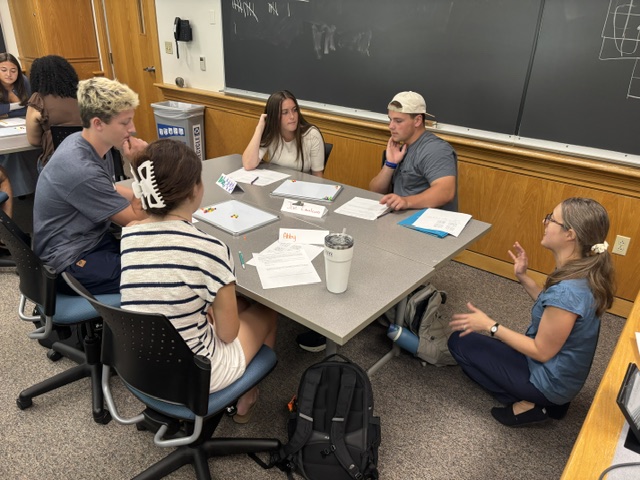
Next up, was a two-player game. Groups split into pairs to play a game and try to determine a way to win.

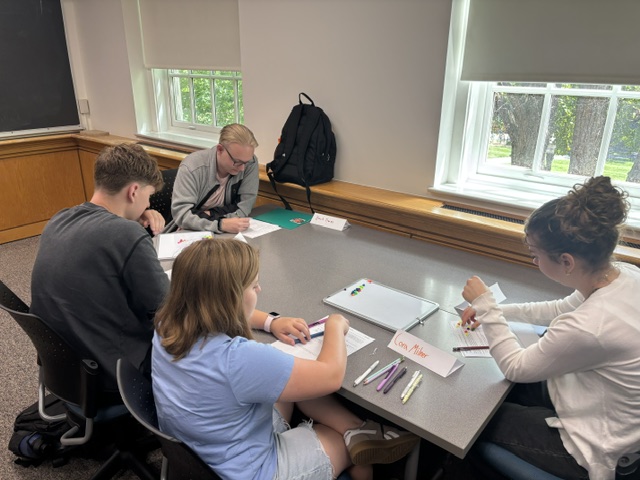
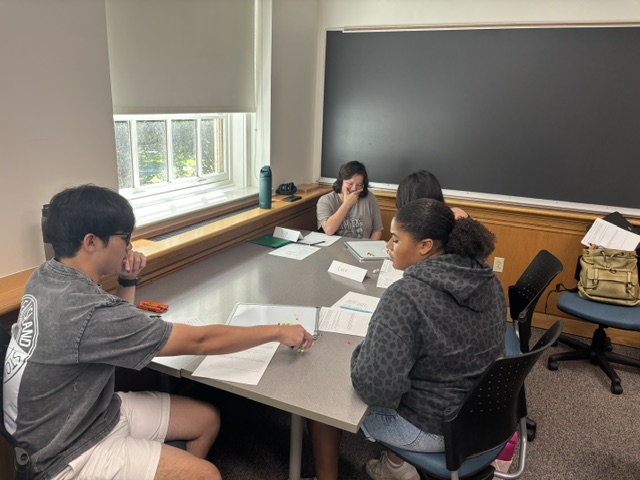
The group in the top middle photo is made up of Finley Wardrip (Mathematical Economics major, ’30), Joe Cavalcanti (Mathematical Economics major, ’30), Abigail Angler (Applied Mathematics Major, ’30) and Rose Wayland (Mathematics Major, ’30)

The group in the top right photo is made up of Zach Timms (Mathematics major, ’30), Cora Milner (Applied Mathematics Major, ’30), Emily Koplin (Mathematical Economics major, ’30), and Nathan Small (Statistics Major and Data Science Co-Major, ’30).

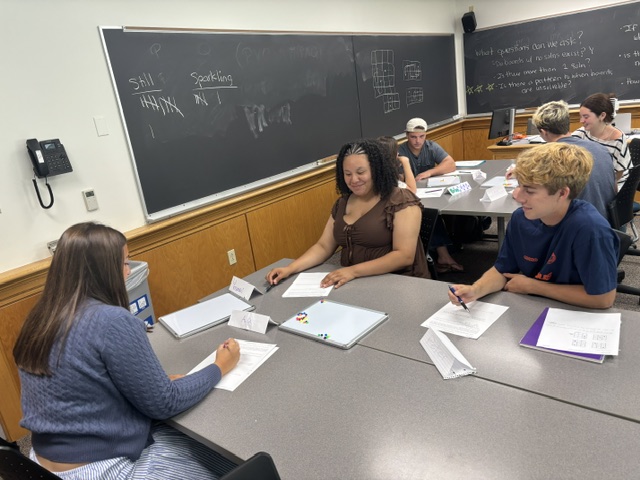
The group in the bottom left photo is made up of Izzy Van Dyke (Mathematics major, ’30), Cece Sonthonnax (Applied Mathematics Major, ’30), Nguyen Nguyen (Mathematical Economics major, ’30) and Ariah Vona (Mathematics Major + seeking teacher certification, ’30)

The group in the bottom right is made up of Ava Abrahamson (Mathematical Economics Major, ’30), Yosmairi Arias (Mathematics Major + seeking teacher certification, ’30), and Peter Caputa (Mathematical Economics major, ’30).

Connect to Department of Mathematics and Statistics at Bucknell University on LinkedIn.

Two players start with 10 beads and take turns taking beads until someone takes the last bead and is declared a winner.

Want to experience this game yourself? Grab a friend and put 10 beads/pennies/pick your object on a table. During each turn, a player can take between 1 and 4 beads. How do you win? Take the last bead. Can you come up with a winning strategy? What if you start with 11 beads? 24 beads? N beads?

Want a chance to be featured in a future blog post? Respond to our question of the week here, and your answer may be chosen for a future post.