Department Connections to Bucknell’s 2026 30 Under 30 List

Each year, Bucknell releases a 30 Under 30 List to celebrate Bucknell alums during Homecoming weekend. This year, many of the honorees have a connection to our department, and we want to give them a shout out!

Emily Shapiro (’19, Education Major – B.S. in Early Childhood Education and Teaching) is an Elementary Math Interventionist at Mahwah Township Public Schools and an Adjunct Professor at William Paterson University. While she was at Bucknell, she worked on research with Prof. Lara Dick to study what online resources elementary math teachers are using. Read more about their work:

Follow bucknell.math.stat on Instagram!

Prof. Abby Flynt taught Isabella Björkeson (’20, Mechanical Engineering and Engineering Management major, now Associate Director of Procurement at Unilever) and Will Snyder (’21, Neuroscience major, now a Postdoctoral Research Fellow at the University of Pennsylvania, Children’s Hospital of Philadelphia) in her Introduction to Data Science Integrated Perspectives course, co-taught with Prof. Brian King of the Computer Science Department. (Thanks for the shout out, Isabella!). Prof. Flynt also taught Kenzie Burns (’20, Environmental Engineering major, now an Assistant Professor atLafayette College) in a statistics for engineers course, and Kenzie went on to help recommend Prof. Flynt for the James P. Crawford EPaDel Section Award for Distinguished College or University Teaching.

Prof. Sam Gutekunst taught Nicholas Caravias (’22, Computer Science major, now AI Software Engineer at Growth Protocol) and Thomas Smith (’23, Computer Engineering, now Software Engineer at Lockheed Martin Corporation) in a discrete mathematics course. Prof. Gutekunst also worked with Thomas on research related to Bucknell enrollment forecasting algorithms and consulting work for Spindrift. Before Thomas graduated, he won the Phi Beta Kappa for outstanding research and took advantage of the “nifty idea” fund. Find out more here.

Jaxon White (’23, Political Science and English-Creative Writing major, now a Capitol Reporter at Spotlight PA) came to visit Prof. Sara Stoudt’s Foundation Seminar, Storytelling with Data, to encourage her students to contribute to the Bucknellian. Her students Caleb Schmidt (’26, Economics major) and Nathan Casara (’26, Computer Science and Enginerring major) went on to write about a visualization tool for data journalism (read it here) and Anthony Rotelle (‘J25, Economics major) reported on student government elections (read it here).

Hear more from Emily and Nicholas in this video where some of the honorees talk a little bit about what this honor and Bucknell mean to them.

Connect to Department of Mathematics and Statistics at Bucknell University on LinkedIn.

Are you a current or past 30 Under 30 winner who took an impactful mathematics and statistics course? Reach out on LinkedIn so we can (belatedly) celebrate you! Want a chance to be featured in a future blog post? Respond to our question of the week here, and your answer may be chosen for a future post.

A Day in Math 358: Topics in Operations Research

Operations Research (OR) is often referred to as “the science of decision making.” Applications of OR span all domains, from scheduling Major League Baseball games to planning the modernization of airline fleets; from designing the optimal configuration of lines at Disney World attractions to assigning nurses to patients in emergency rooms; from streamlining factory floor operations to optimizing large-scale transportation logistics.

One unit of MATH 358: Topics in Operations Research is devoted to studying Markov Chain models.

Markov chains allow us to study and predict the long-term behavior of systems that evolve over time in uncertain ways. Popular applications include queueing systems, inventory management, and animal migration patterns. Perhaps the most famous Markov chain model is Google’s PageRank algorithm, which is used to help determine which web pages appear at the top of a Google search.

Many board games, including Monopoly, Chutes and Ladders, and Hi-Ho Cherry-O, can be analyzed using Markov chain models. MATH 358 students, taught by Prof. Lucas Waddell this semester, first warmed up by reviewing the math behind the game of Craps (also a Markov chain). They rolled some dice and kept track of their wins and losses.

Top left: Prof. Waddell in front of the class

Top middle: Bret Cozby (’28, Mathematical Economics major) and Olivia Seward (’26, Mathematical Economics major)

Top right: Michael Amante (’27, Mathematical Economics major and Italian Studies major), Will Lindquist (’27, Statistics major), and Kerry O’Day (’28, Mathematical Economics major)

Bottom first row: Skyler Le (’27, Mathematics major), Roger Chen (’28, Applied Mathematics major), Cornelius Nichilo (’27, Mathematical Economics major), Zach Selfon (’27, Mathematical Economics major)

Bottom second row: Samuel Berry (’27, Applied Mathematics major), Reed Nester (’27, Mathematical Economics major)

Follow bucknell.math.stat on Instagram!

To get some more hands-on experience with Markov chain modeling, the students went on to investigate the classic game, Cootie. In the game Cootie, players race to construct a Cootie bug, which consists of a head, body, one eye piece, one tongue/teeth/lips, one antennae/hat/bow, and six legs. The order in which pieces get added to the partially completed Cootie bug is randomly determined by the roll of a die.

Top right: Skyler Le (’27, Mathematics major), Kerry O’Day (’28, Mathematical Economics major)

Bottom left: Bret Cozby (’28, Mathematical Economics major), Roger Chen (’28, Applied Mathematics major), John Rich (’27, Computer Science and Engineering Major)

Bottom right: John Occhipinti (’27, Mathematical Economics Major), Samuel Berry (’27, Applied Mathematics major), Zach Selfon (’27, Mathematical Economics major)

Students were tasked to play a game of Cootie, and then use their intuition about probability to guess the expected number of turns it would take to somebody to completely construct the Cootie bug. 

After guessing, students created a Markov chain model of the game. This required them to determine that there are 30 unique states that the Cootie bug can be in on its journey from the beginning of the game to the end, and to calculate transition probabilities between these states. For example, if the Cootie bug currently has just a body and a head, there is a 1/6 probability that after the next turn, the Cootie bug will have a body, a head, and one leg.

The students were then able to calculate that the expected number of turns in a game of Cootie is (spoiler warning) 48.2694 turns.

A homework assignment asked them to think about how the model would change if the game was played with a weighted die. Another spoiler warning… it changes significantly.

Connect to Department of Mathematics and Statistics at Bucknell University on LinkedIn.

Are you an alum who took 358? We’d love to hear about what that experience was like for you, so reach out on LinkedIn! Want a chance to be featured in a future blog post? Respond to our question of the week here, and your answer may be chosen for a future post.

Gearing back up for the Putnam!

The William Lowell Putnam Mathematical Competition is a prestigious mathematics contest for undergraduates studying in the U.S. and Canada which has taken place annually since 1927.

Bucknell students have had some terrific performances in recent years. Last year, Bucknell ranked 68 out of 487 schools, and third in the Mathematical Association of America section that covers Eastern Pennsylvania and Delaware (EPaDel) behind Penn and Haverford. Skyler Le (’27, Mathematics major) had a score of 32, with a rank of 369 out of 4329 participants.

In preparation for this year’s event, taking place on Saturday, December 5th, there are also student-led practice sessions every Tuesday in the Olin Math Lounge, led by Meshkat Alam (’28, Physics and Mathematics major).

Follow bucknell.math.stat on Instagram!

Want to try a problem of your own? Here’s an example to think about.

A grasshopper starts at the origin in the coordinate plane and makes a sequence of hops. Each hop has length 5, and after each hop the grasshopper is at a point whose coordinates are both integers; thus, there are 12 possible locations for the grasshopper after the first hop. What is the smallest number of hops needed for the grasshopper to reach the point (2021, 2021)?

Our department has a strong record of past performance. Shout out to past Mathematics and Statistics Department Competitions Committee chairs for keeping track of the history.

Last year (academic year 2025-2026) we had 12 participants. The Putnam for the academic year 2024-2025 was notoriously difficult. The median score was 2, with the average score at 8 (out of 120). We had 5 students participate. Skyler Le still went on to earn a score of 22 and was ranked among the top 500 participants out of approximately 4,000. In the academic year 2023-2024 we had 8 students participate. Skyler (42 pts) and Anh Tran ’24 (41 pts) were both ranked between 101 and 200 out of the 3,857 total students who took the exam. Bucknell’s team placed 3rd in the EPaDel MAA section. All of the students scored points, and 6 of the 8 students had scores in the double digits.

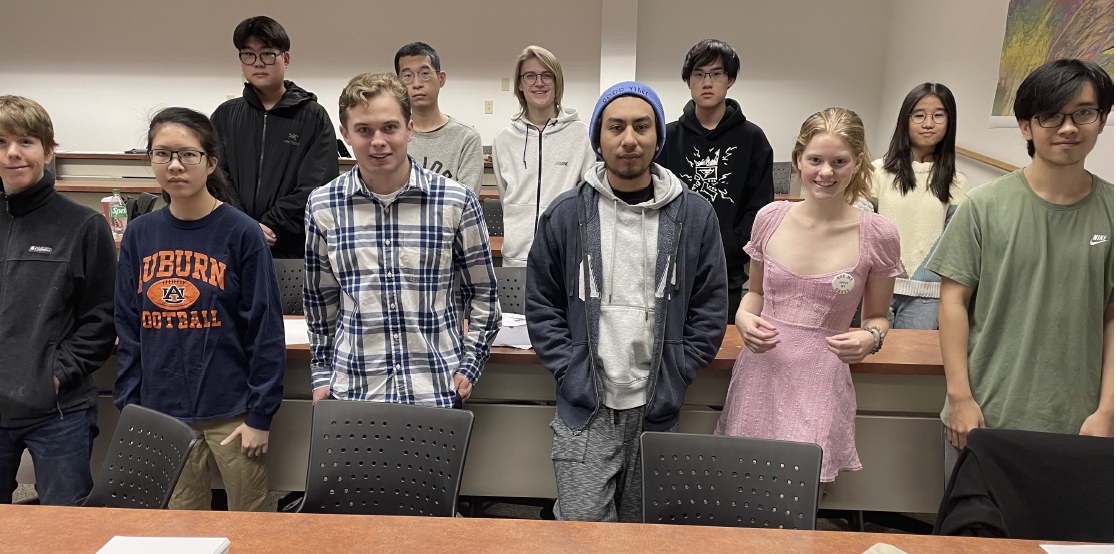
Above is the Academic Year 2022-23 Putnam Participants: Back row (left to right): Changkun Guan ’24, Yang Hong ’23, Jonathan Seitz ’26, Kerong Wang ’24, MinhPhuong Cao ’26. Front row: Mikey Ferguson ’25, Vy Tran ’25, Cole Kratz ’26, Michael Perez Palapa ’23, Susan Deering ’26, Anh Tran ’24. Missing from photo: Clara Chaplin ’25, Jiasong Zhu ’24.

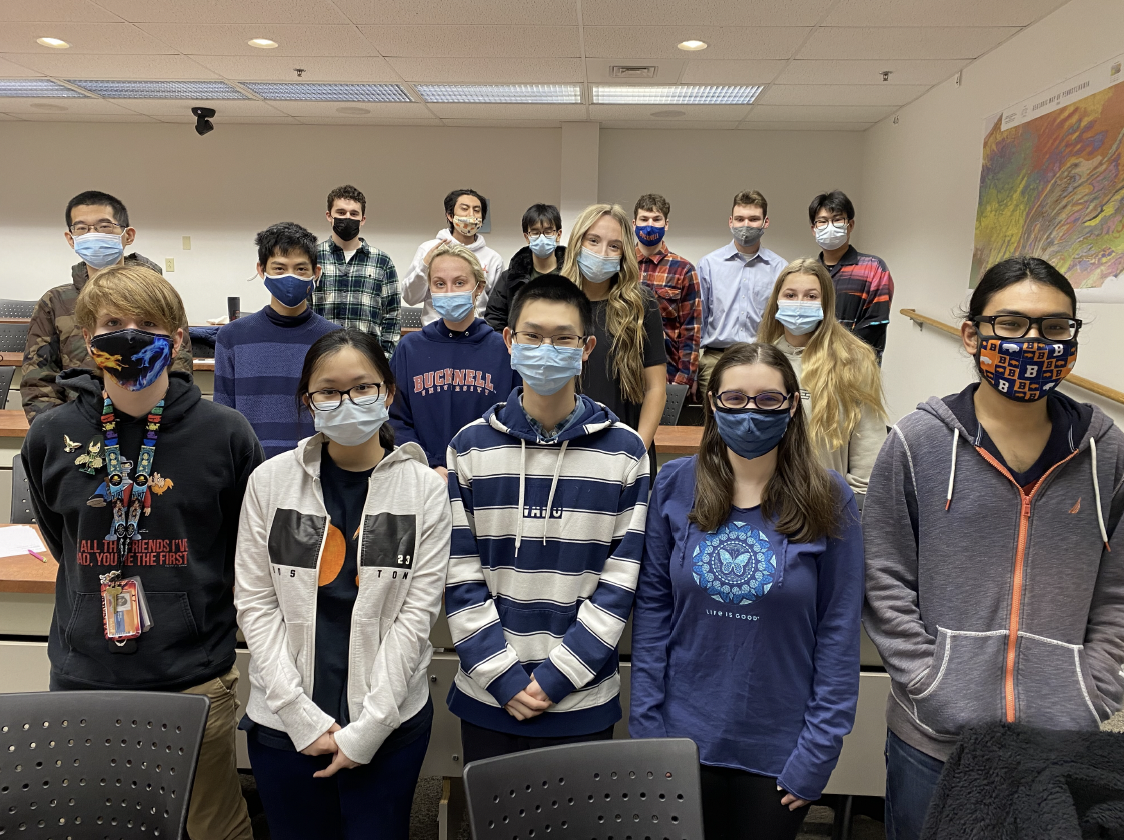
Above is the Academic Year 2021-22 Putnam Participants: Back row (left to right): Alejandro Vargas-Altamirano ’25, Michael Perez Palapa ’23, Anh Tran ’24, Eric Jaeger ’25, Danny Nolan ’25, Changkun Guan ’24. Middle row: Yang Hong ’23, Nghia Le ’24, Lily Fauntleroy ’23, Erin Fitch ’25, Clara Chaplin ’25. Front row: Mikey Ferguson ’25, Anh Kieu ’22, Tianzhu (Peter) Liu ’22, Clare Bassano ’23, Swarup Dhar ’22. Missing from photo: Peter Warhold ’23

Connect to Department of Mathematics and Statistics at Bucknell University on LinkedIn.

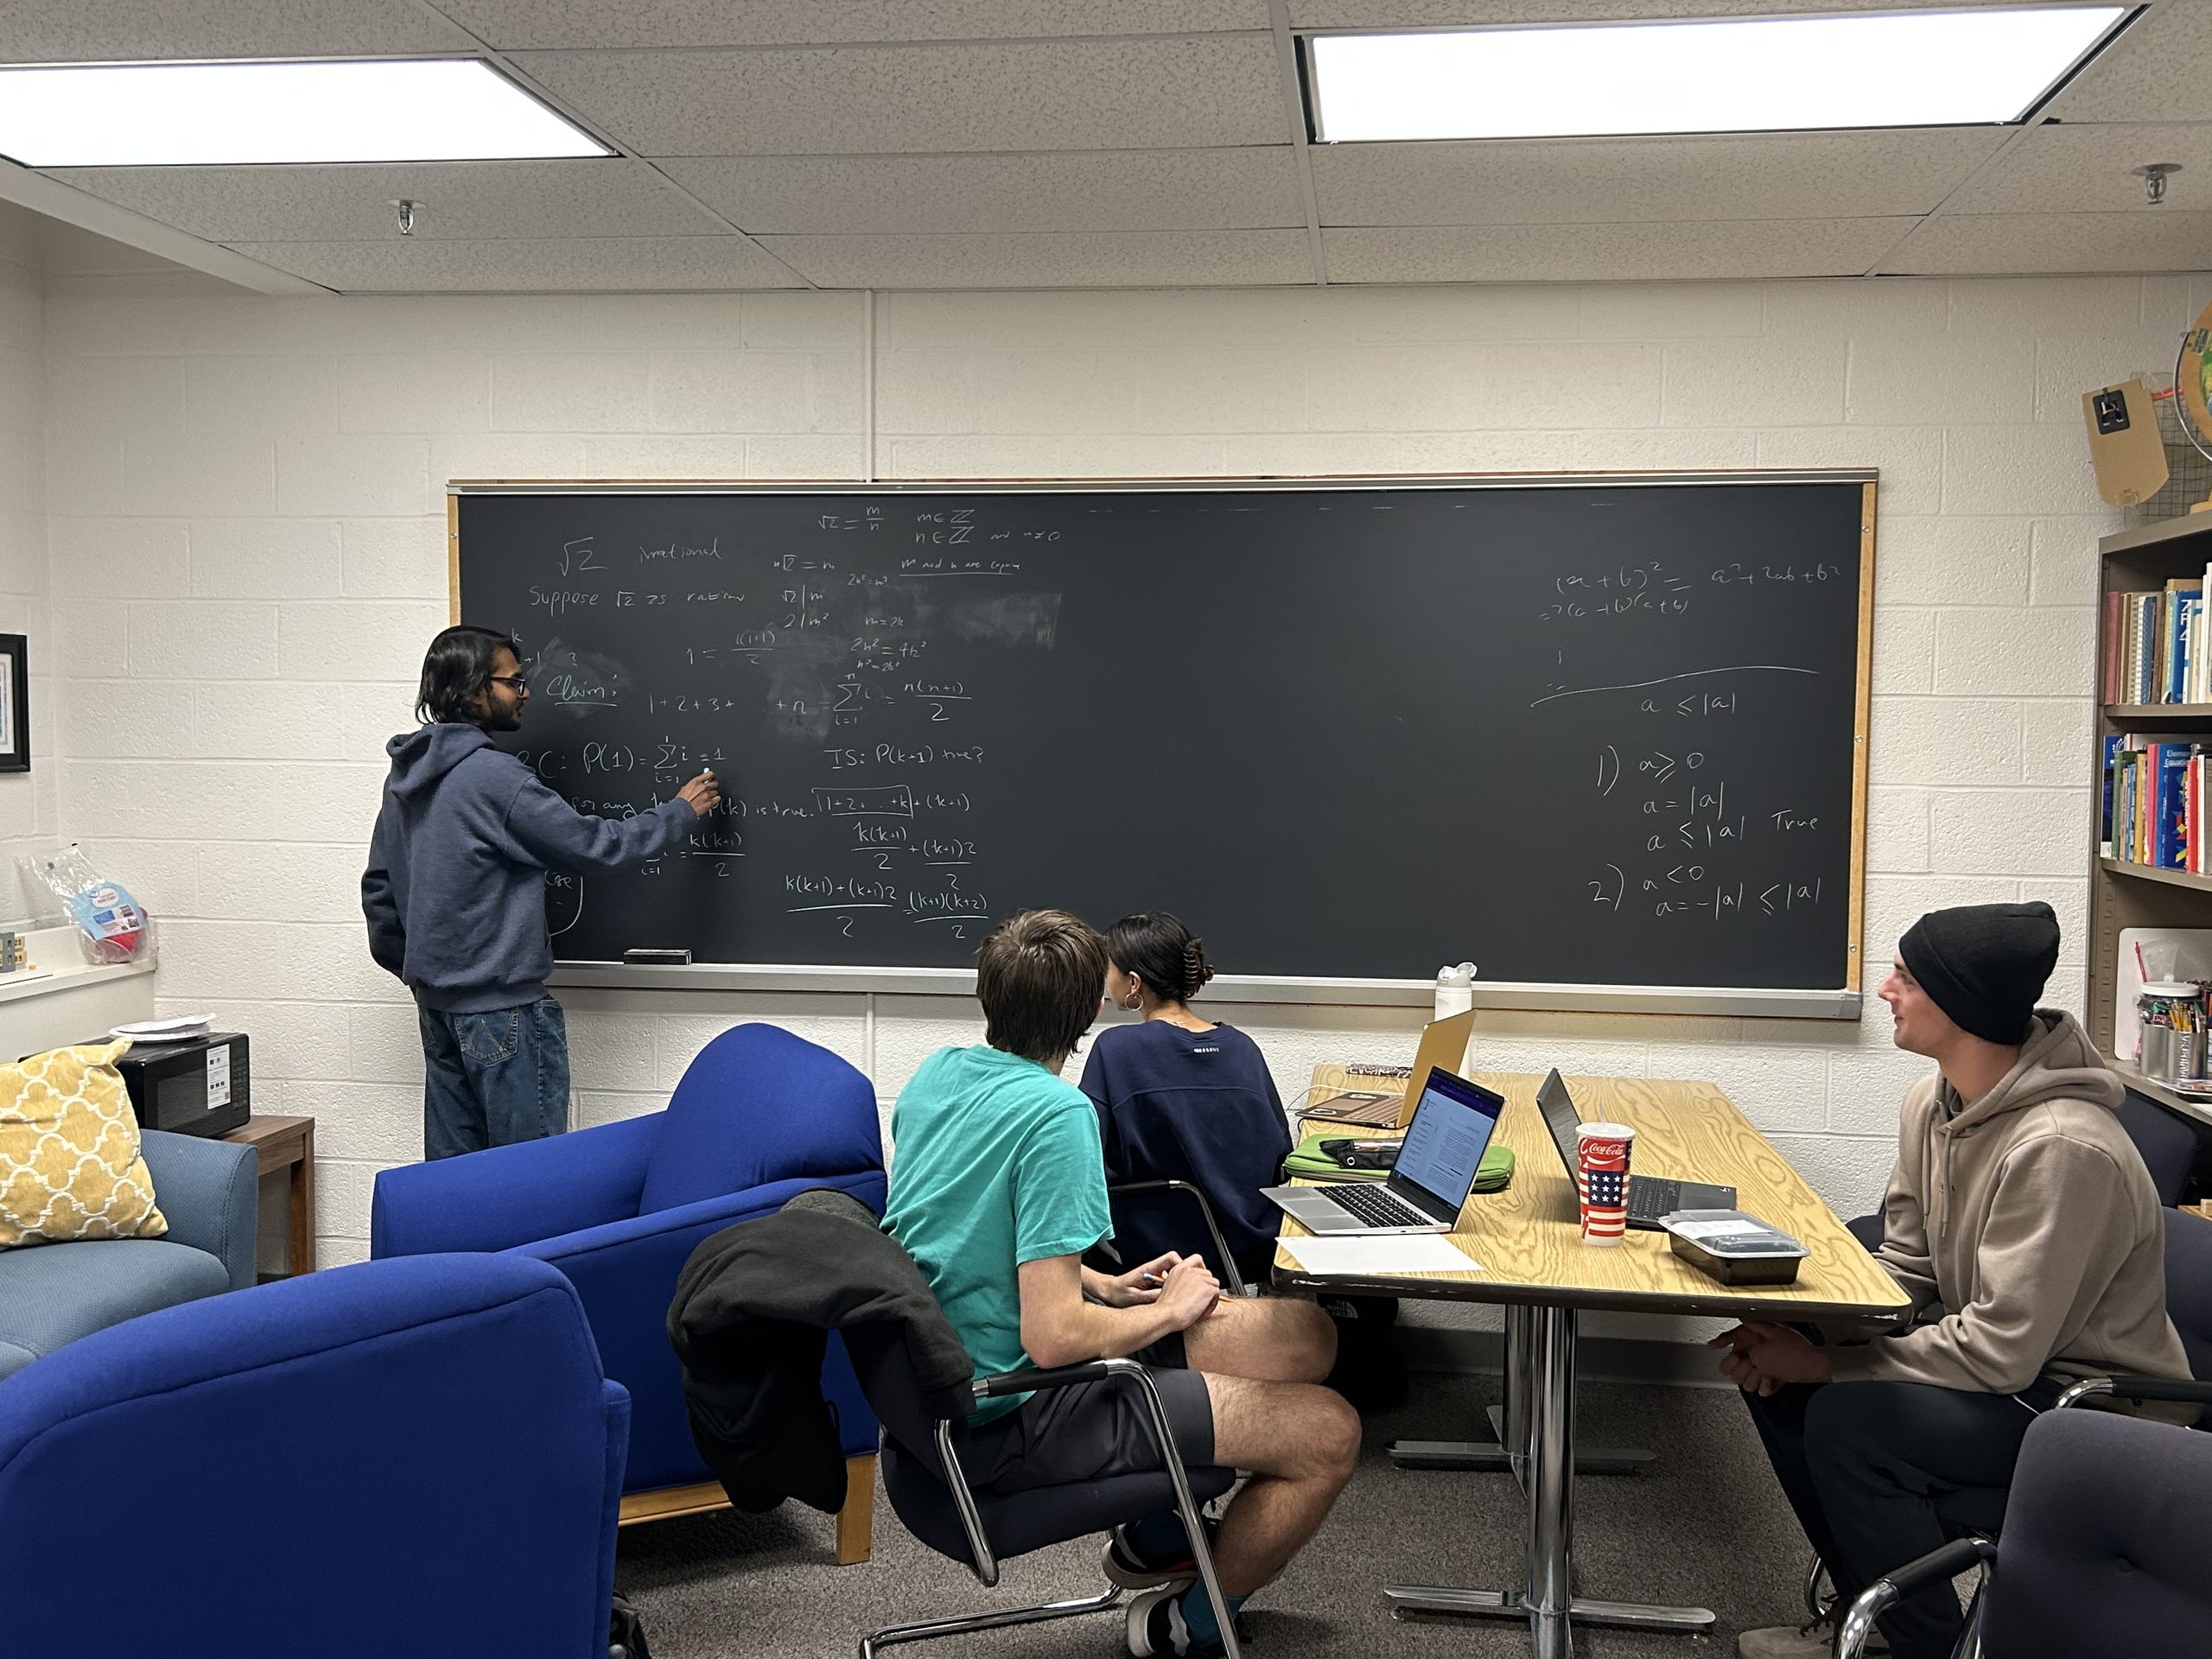
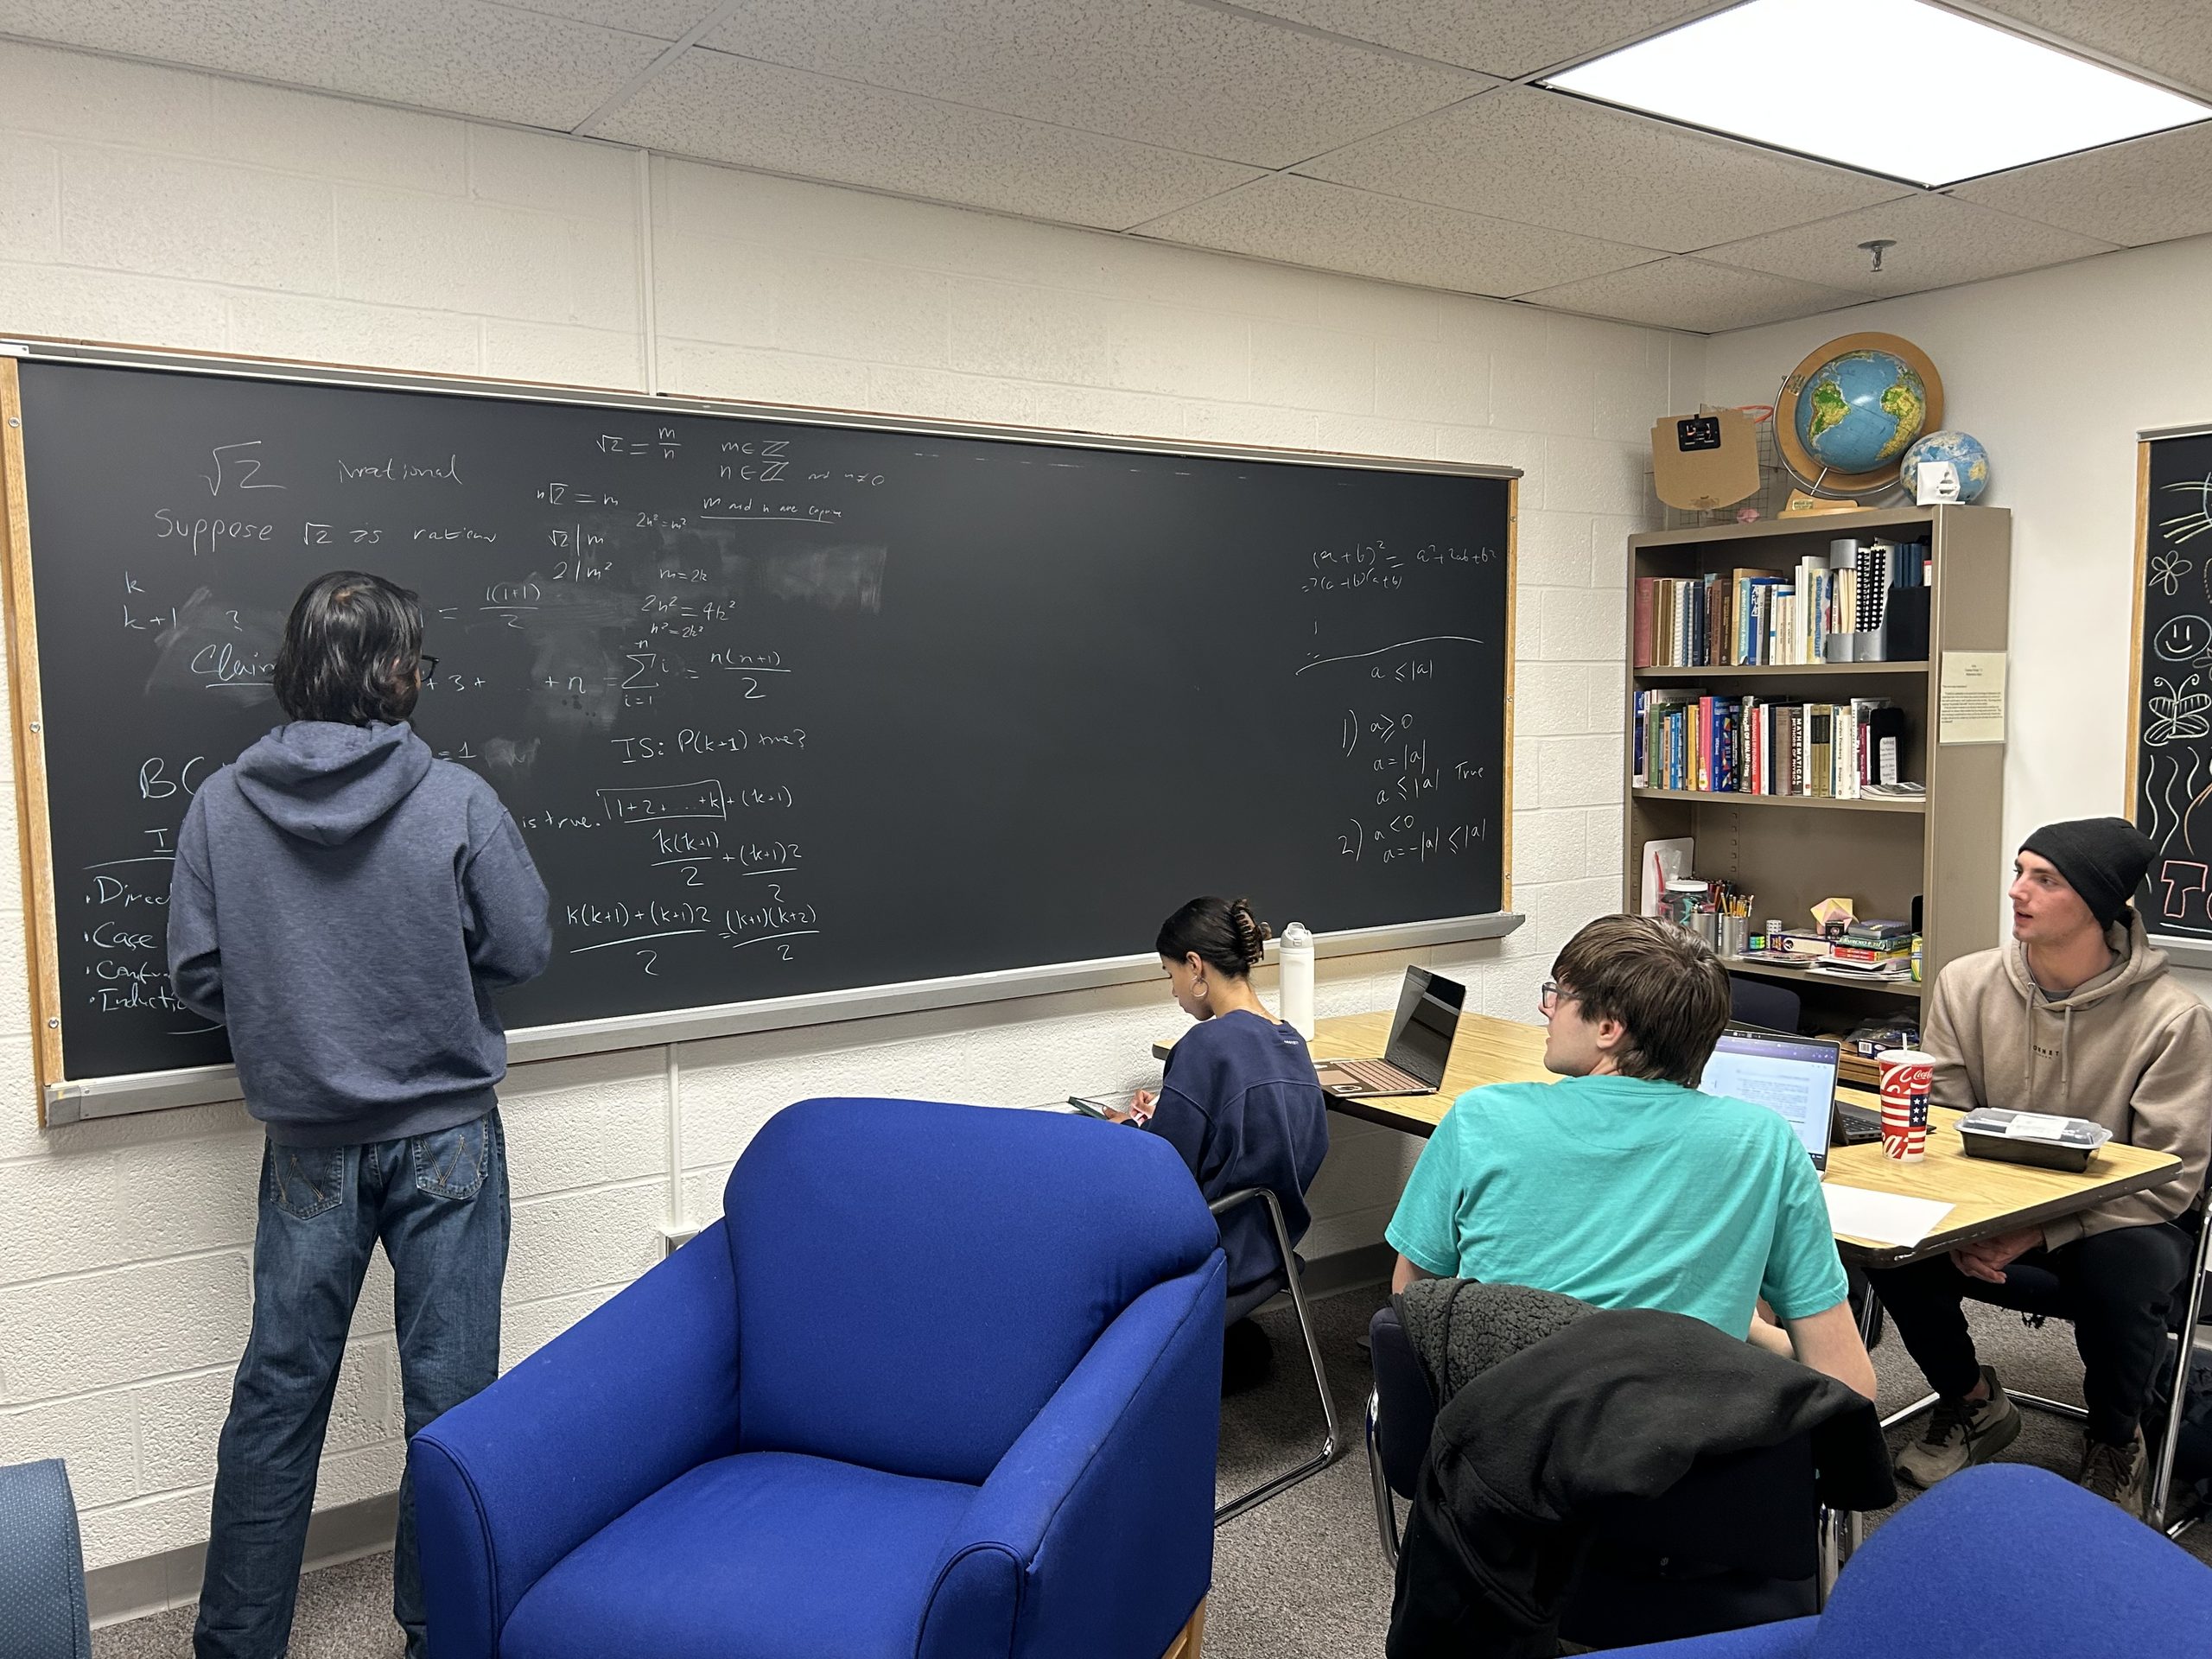
Students who like challenging math problems are encouraged to participate. No advanced mathematical knowledge is required; creative problem-solving is the goal. Participation is free and on-campus. Students who are interested should contact Prof. Langford for more details!

Are you an alum who participated in the Putnam? We’d love to hear about what that experience was like for you, so reach out on LinkedIn! Want a chance to be featured in a future blog post? Respond to our question of the week here, and your answer may be chosen for a future post.

Chalkboard Discussions

This semester, students, faculty, and staff have contributed to weekly chalkboard discussions that have taken a variety of forms.

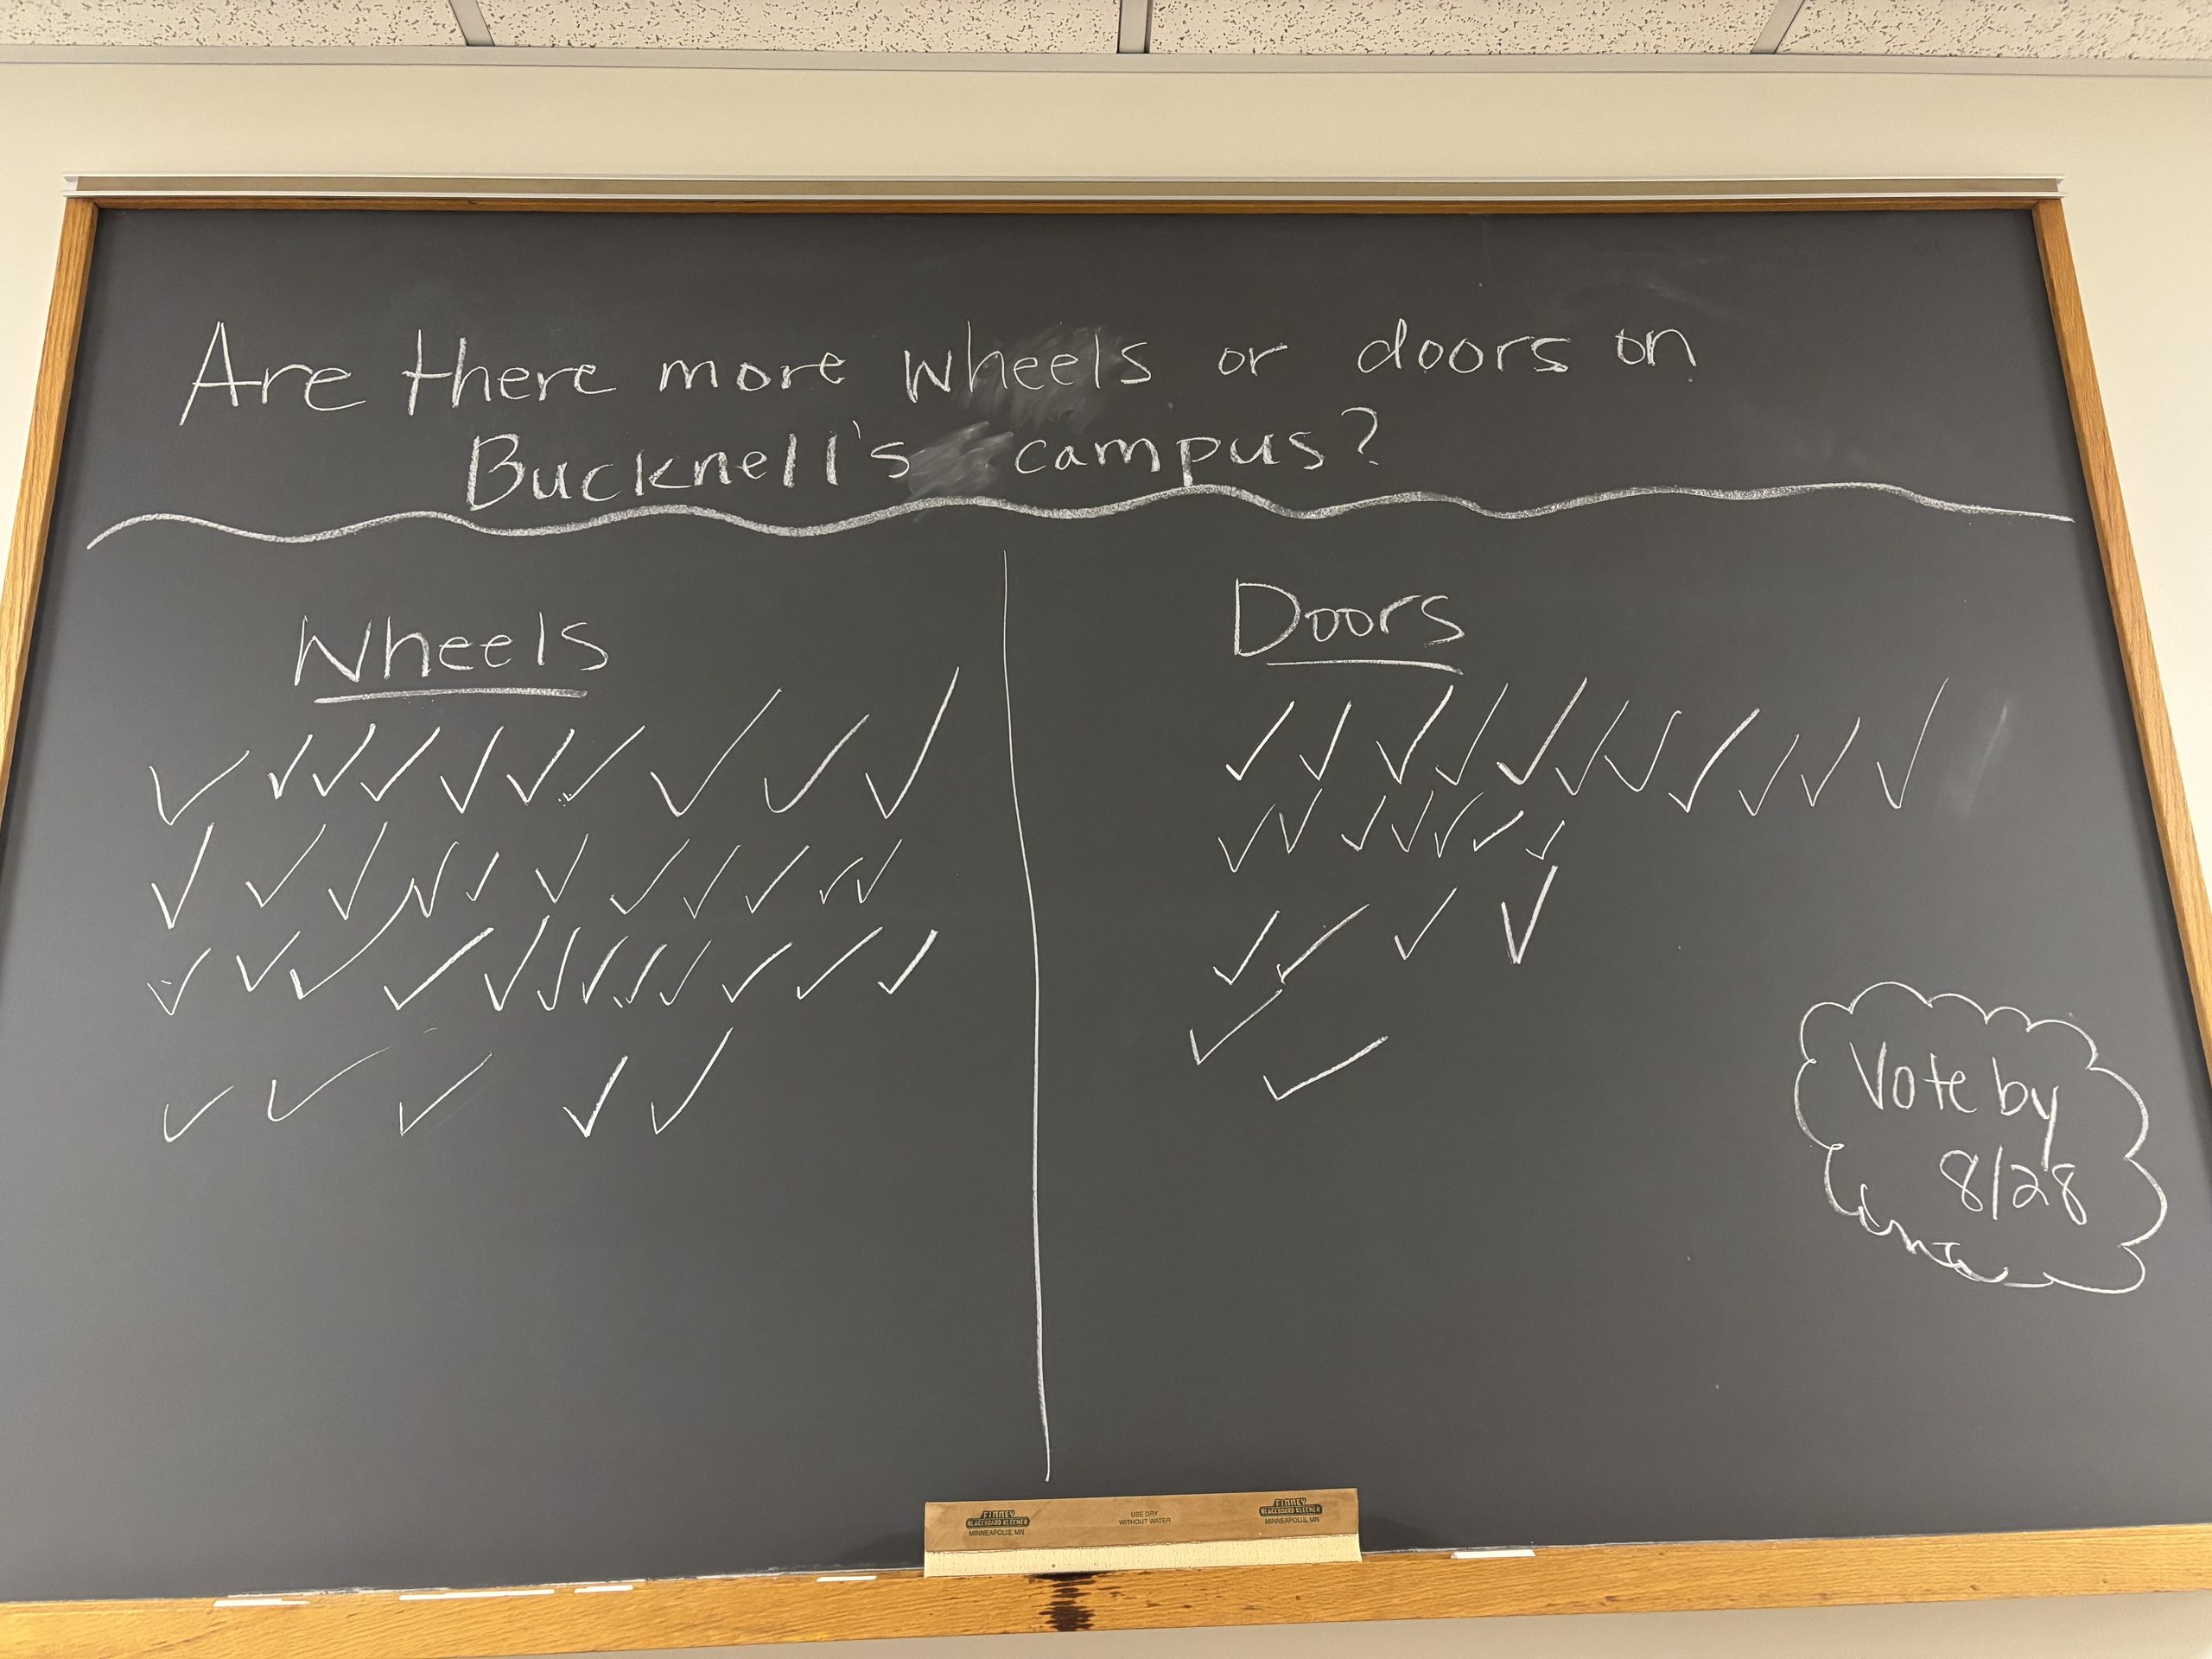
We started off with a controversial one. Are there more wheels or doors on Bucknell’s campus? What counts as a door? A wheel? That’s all part of the fun!

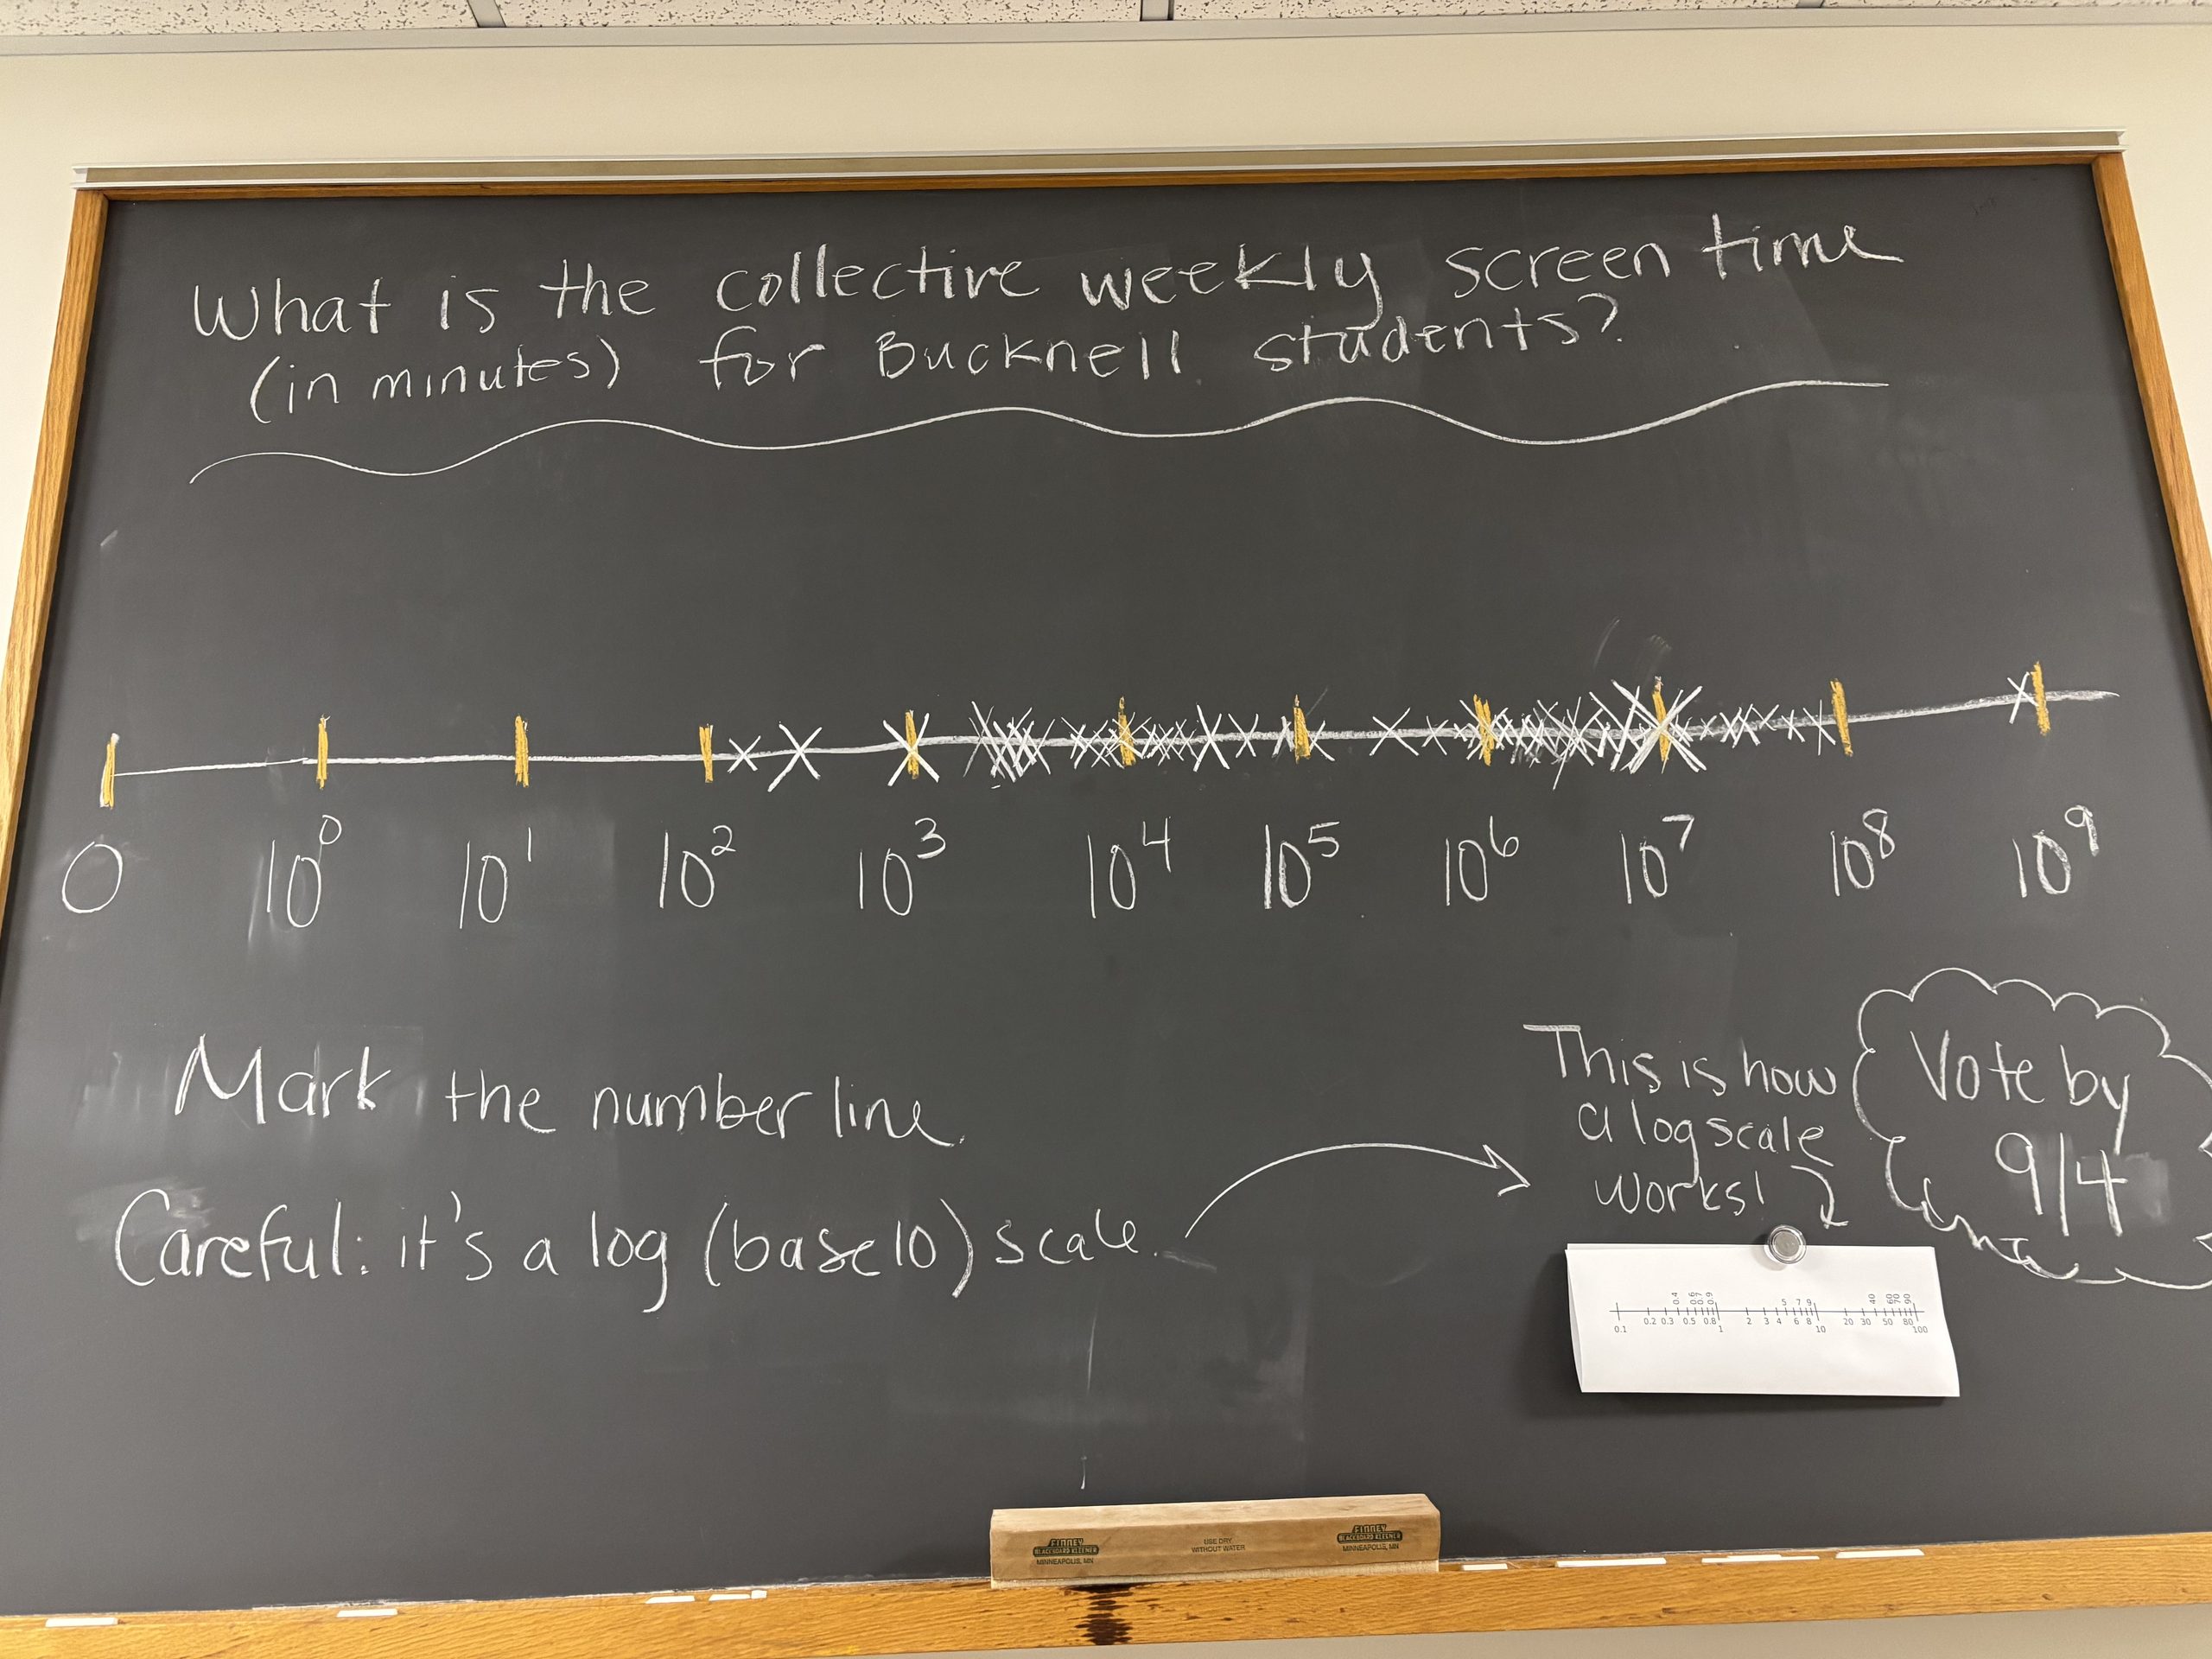
Then we practiced our log scales by guess-timating the collective weekly screen time for Bucknell students.

What is the collective weekly screen time (in minutes) for Bucknell students? Votes cluster in the 10^4 and 10^6 ranges on the log scale.

Follow bucknell.math.stat on Instagram!

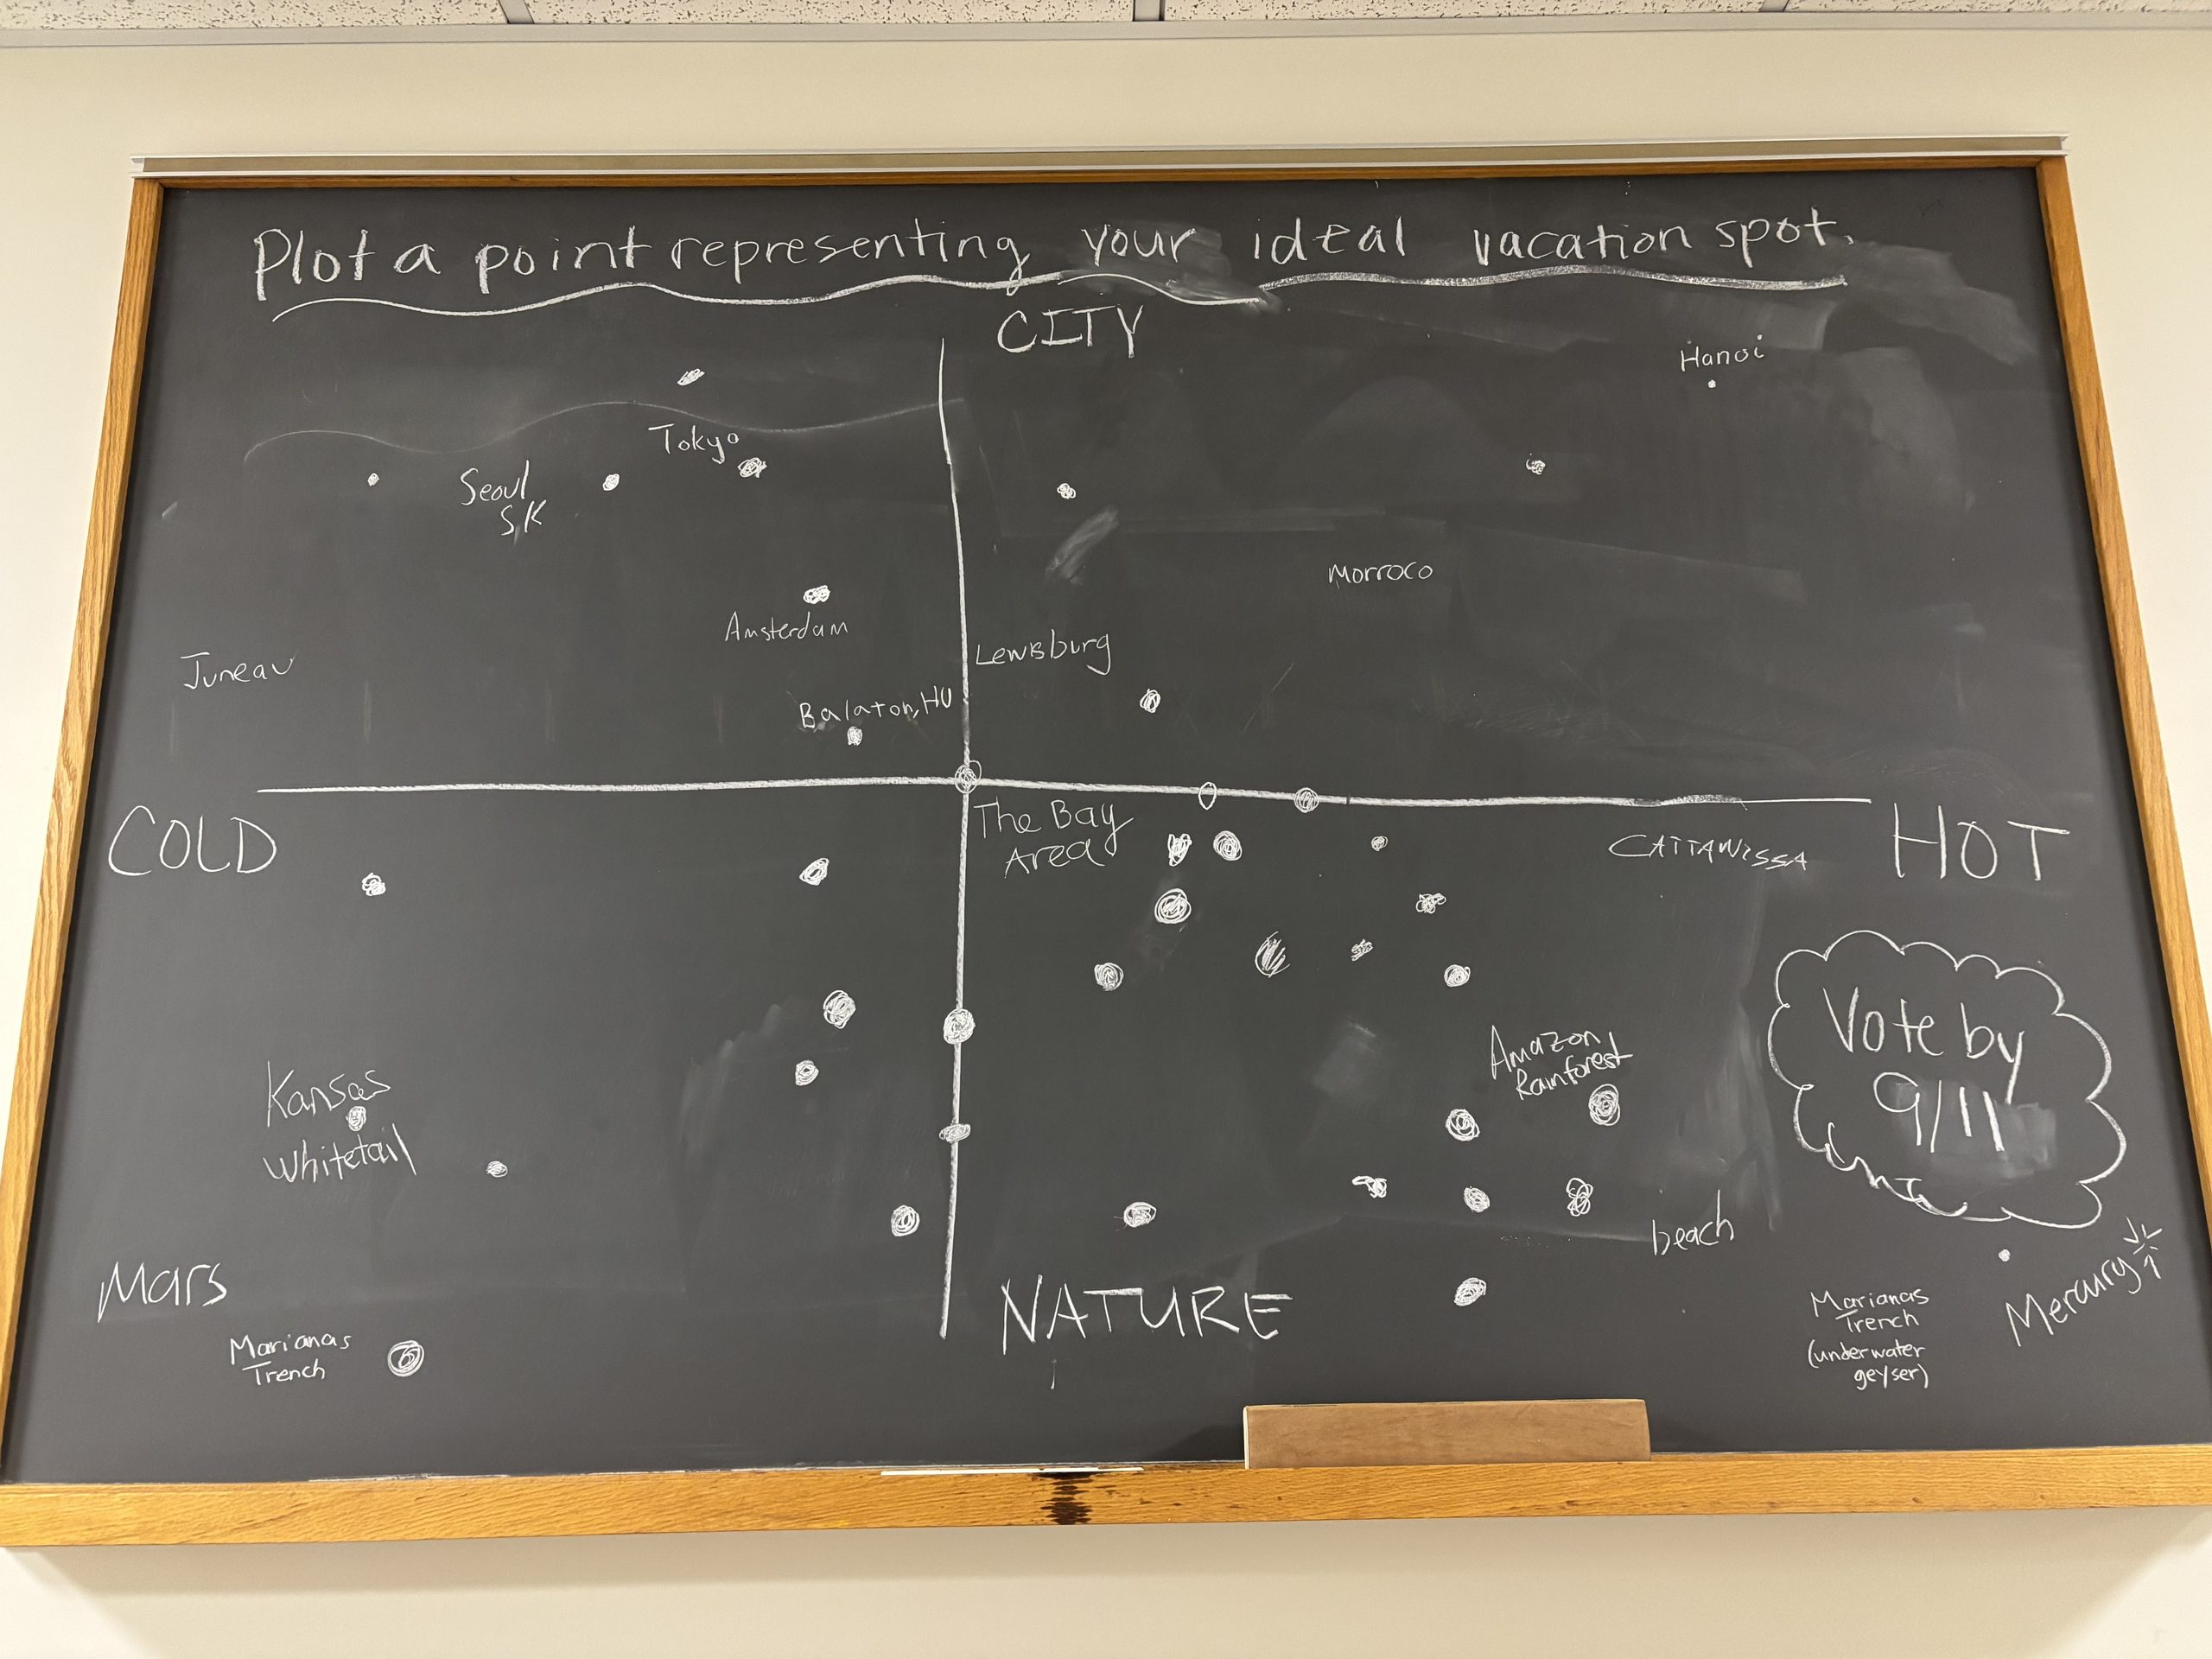
By week 3 we were all already thinking about Fall Break and dreaming about our perfect vacation spots. The Hot/Nature quadrant is most popular!

Points plot ideal vacation spots with the x-axis ranging from cold to hot and the y-axis ranging from nature to city. The nature/hot quadrant has the most points.

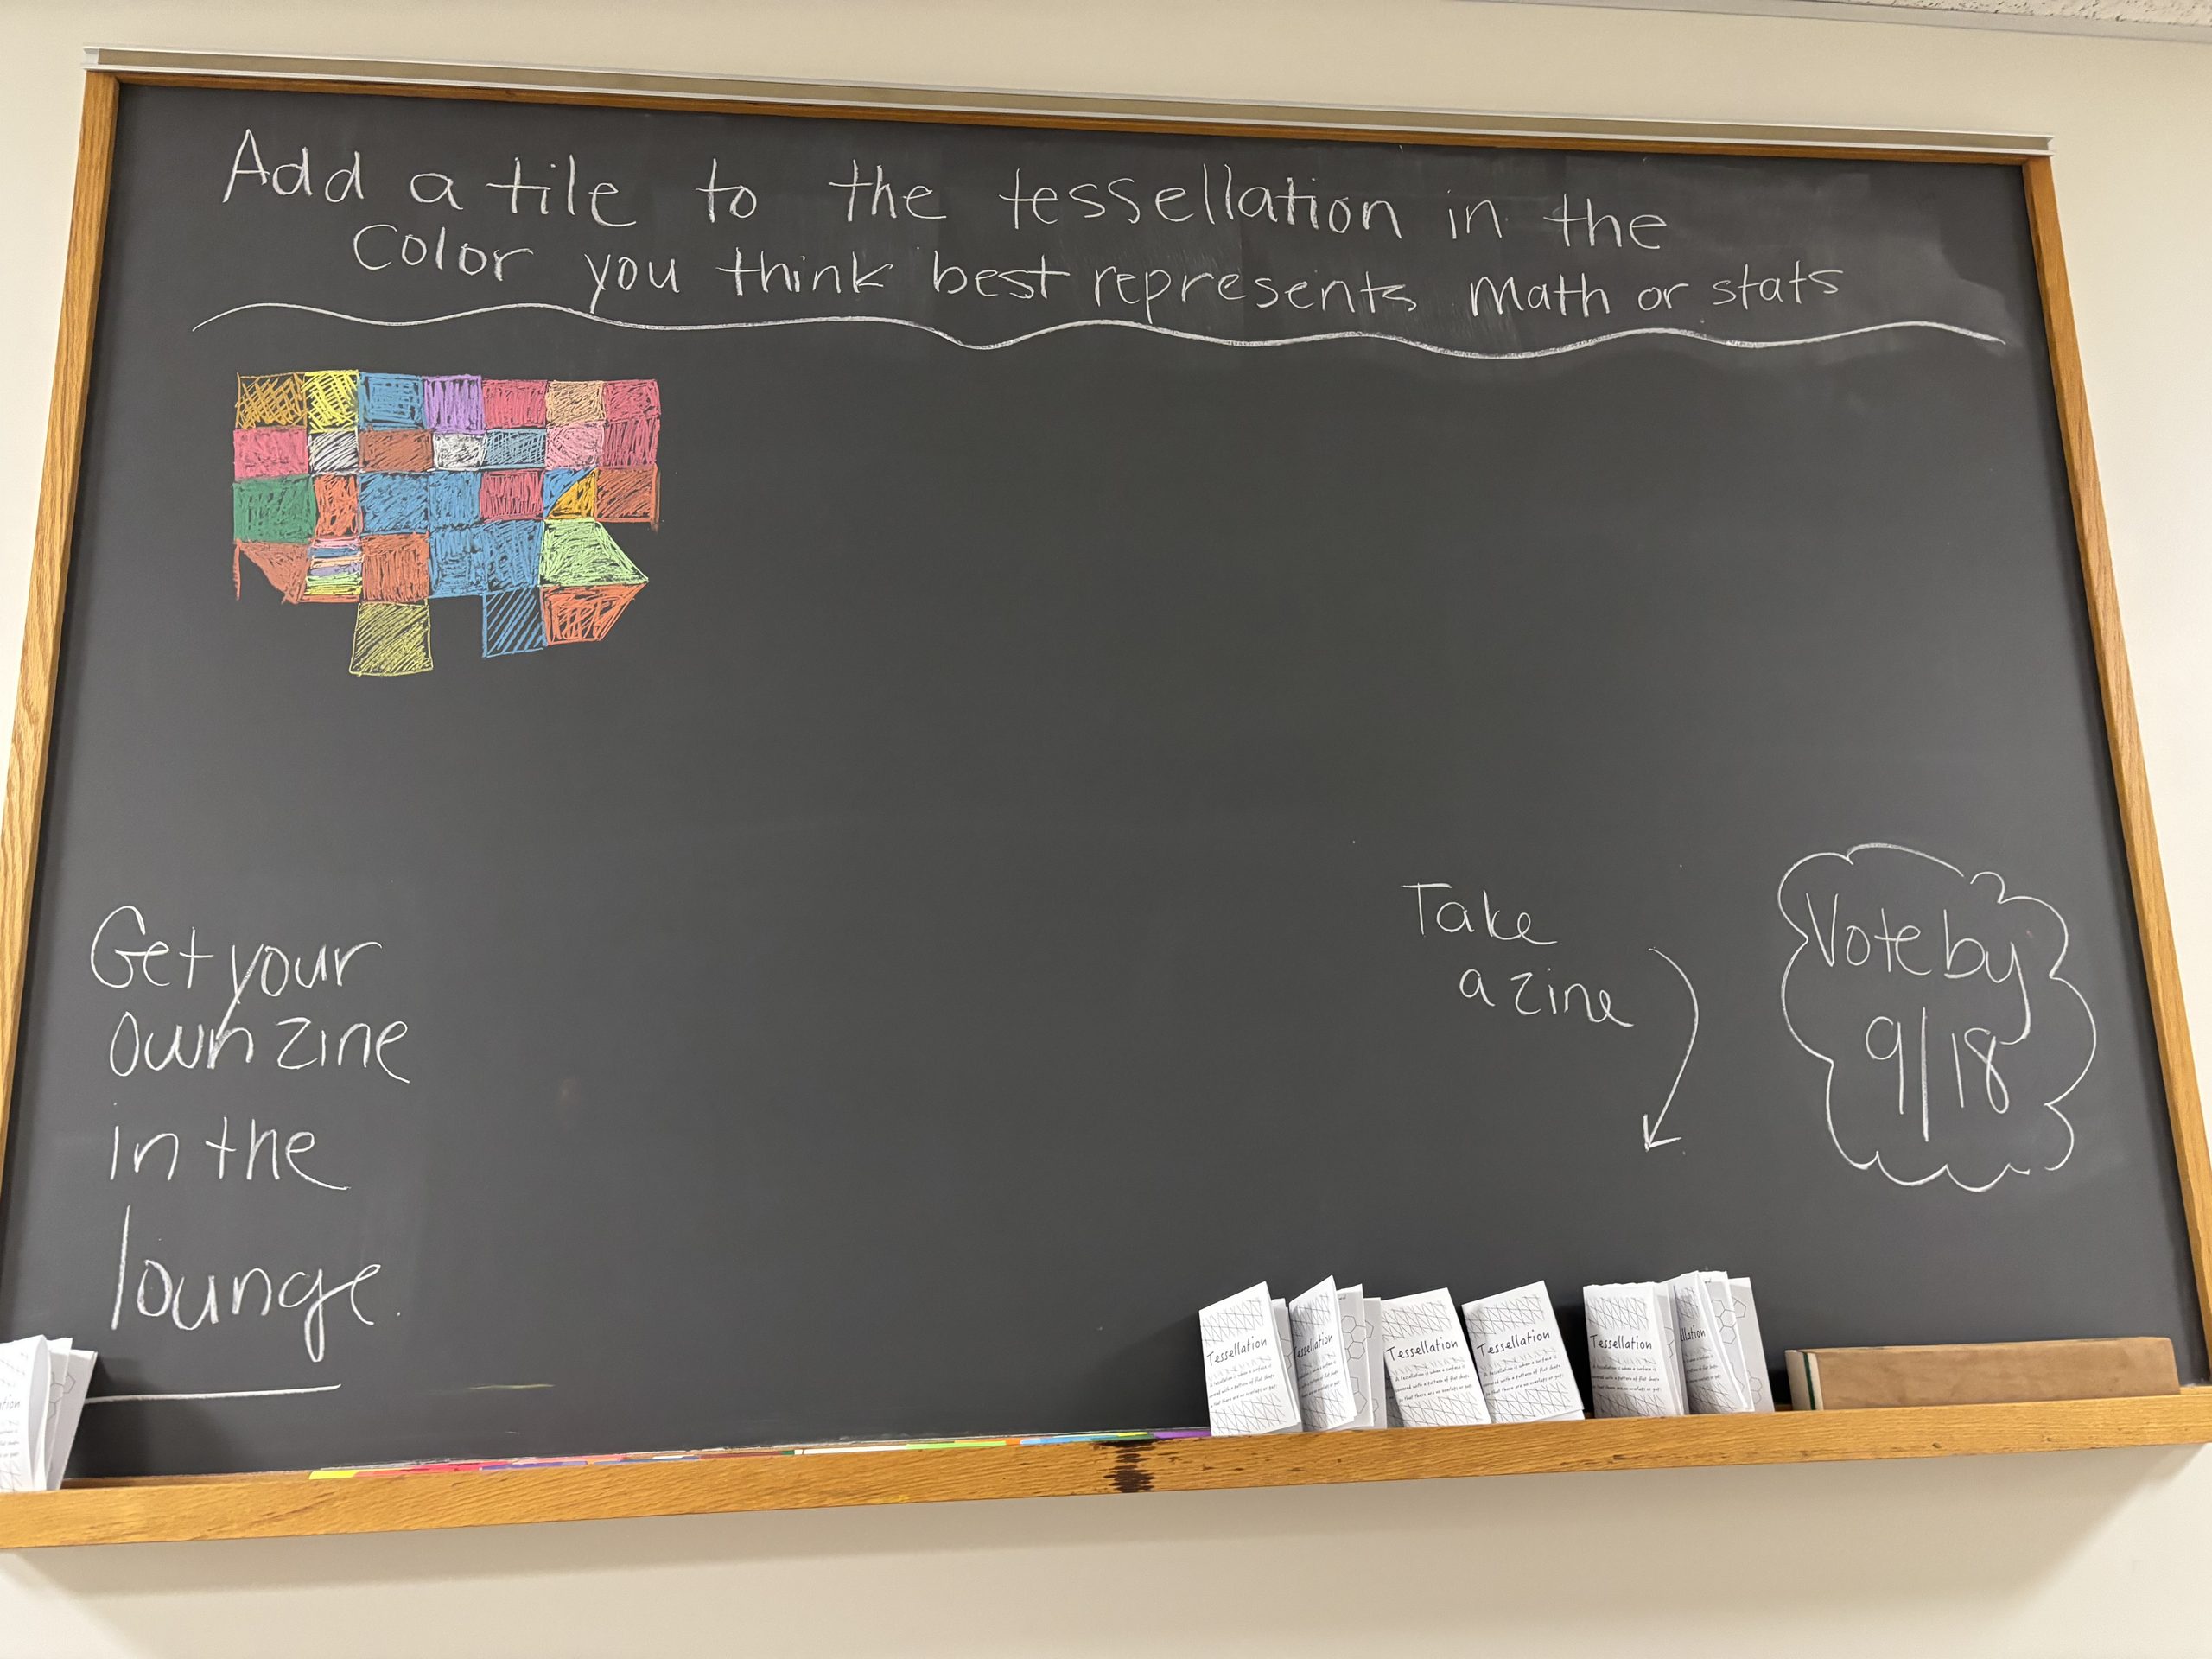
We broke out the special colored chalk to determine what color best represents math or stats while also creating a tessellation. Print and fold your own tessellation zine!

A tessellation of color tiles that best represent math or stats. Blues and pink/orange dominate.

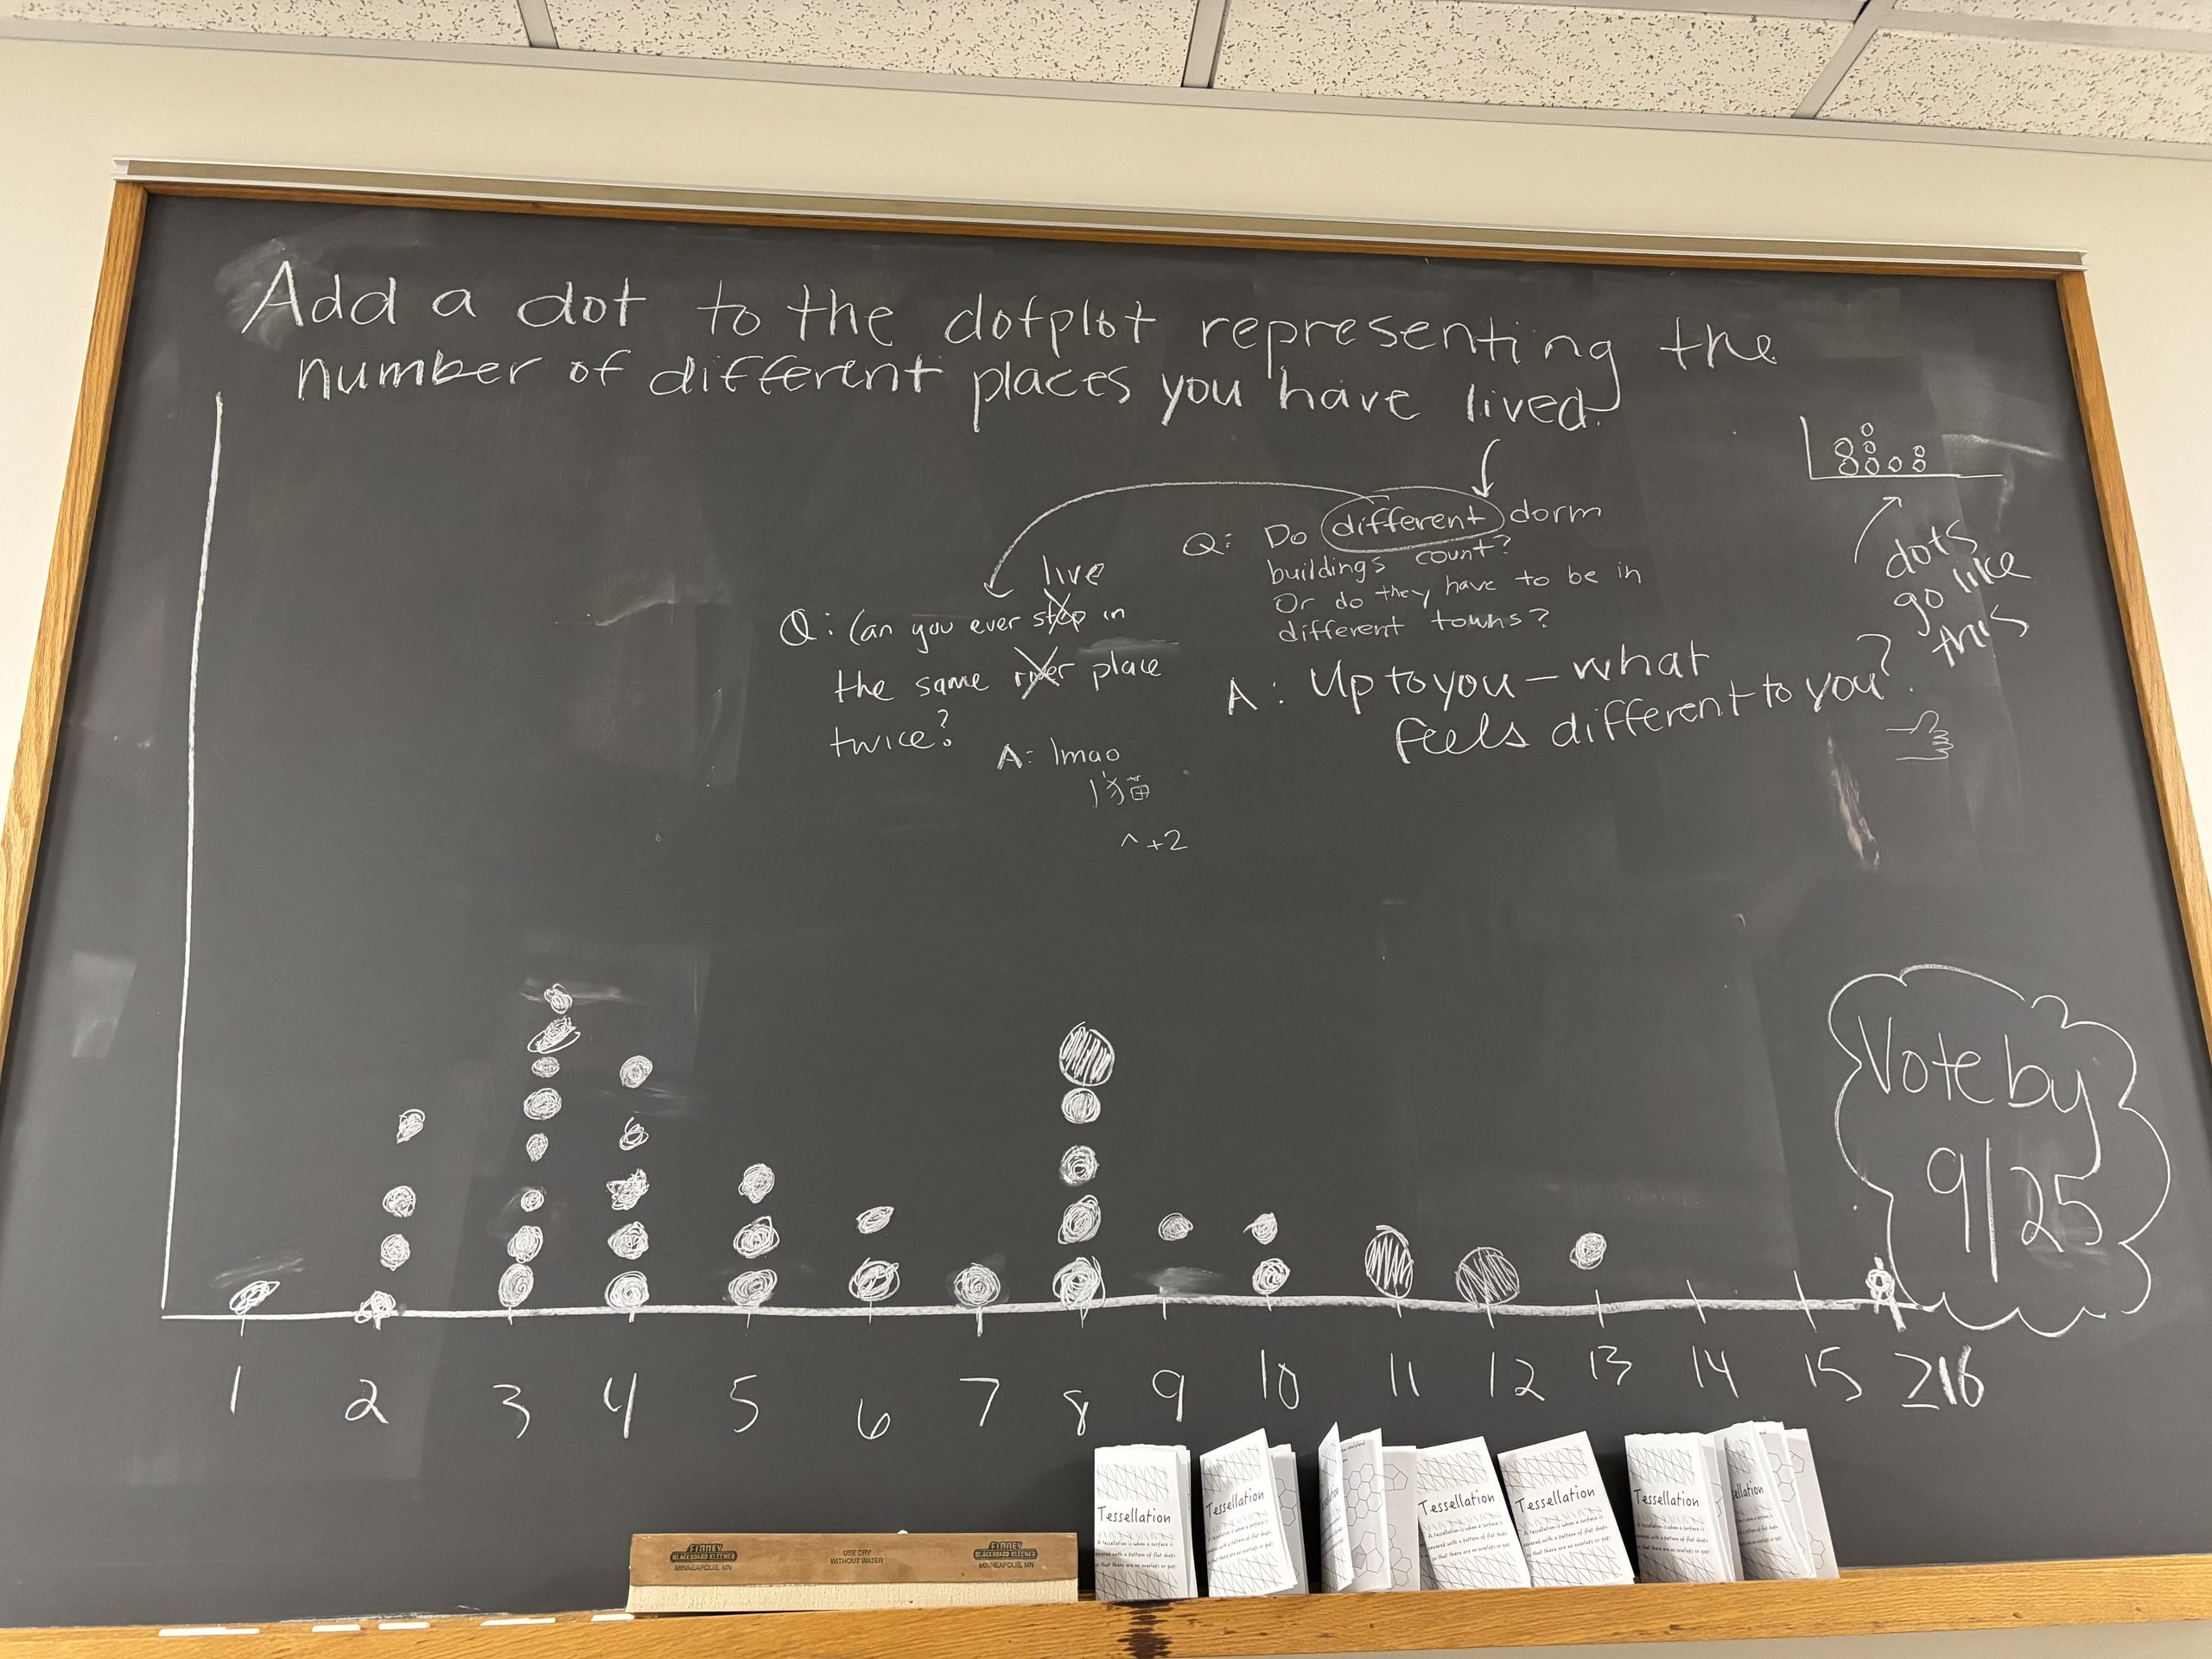
Some good meta-discussion appeared when we were counting the number of different places we have each lived.

Dot plot representing the number of different places you have lived. The 2-4 range has many points, with 8 having another 5 votes.

Connect to Department of Mathematics and Statistics at Bucknell University on LinkedIn.

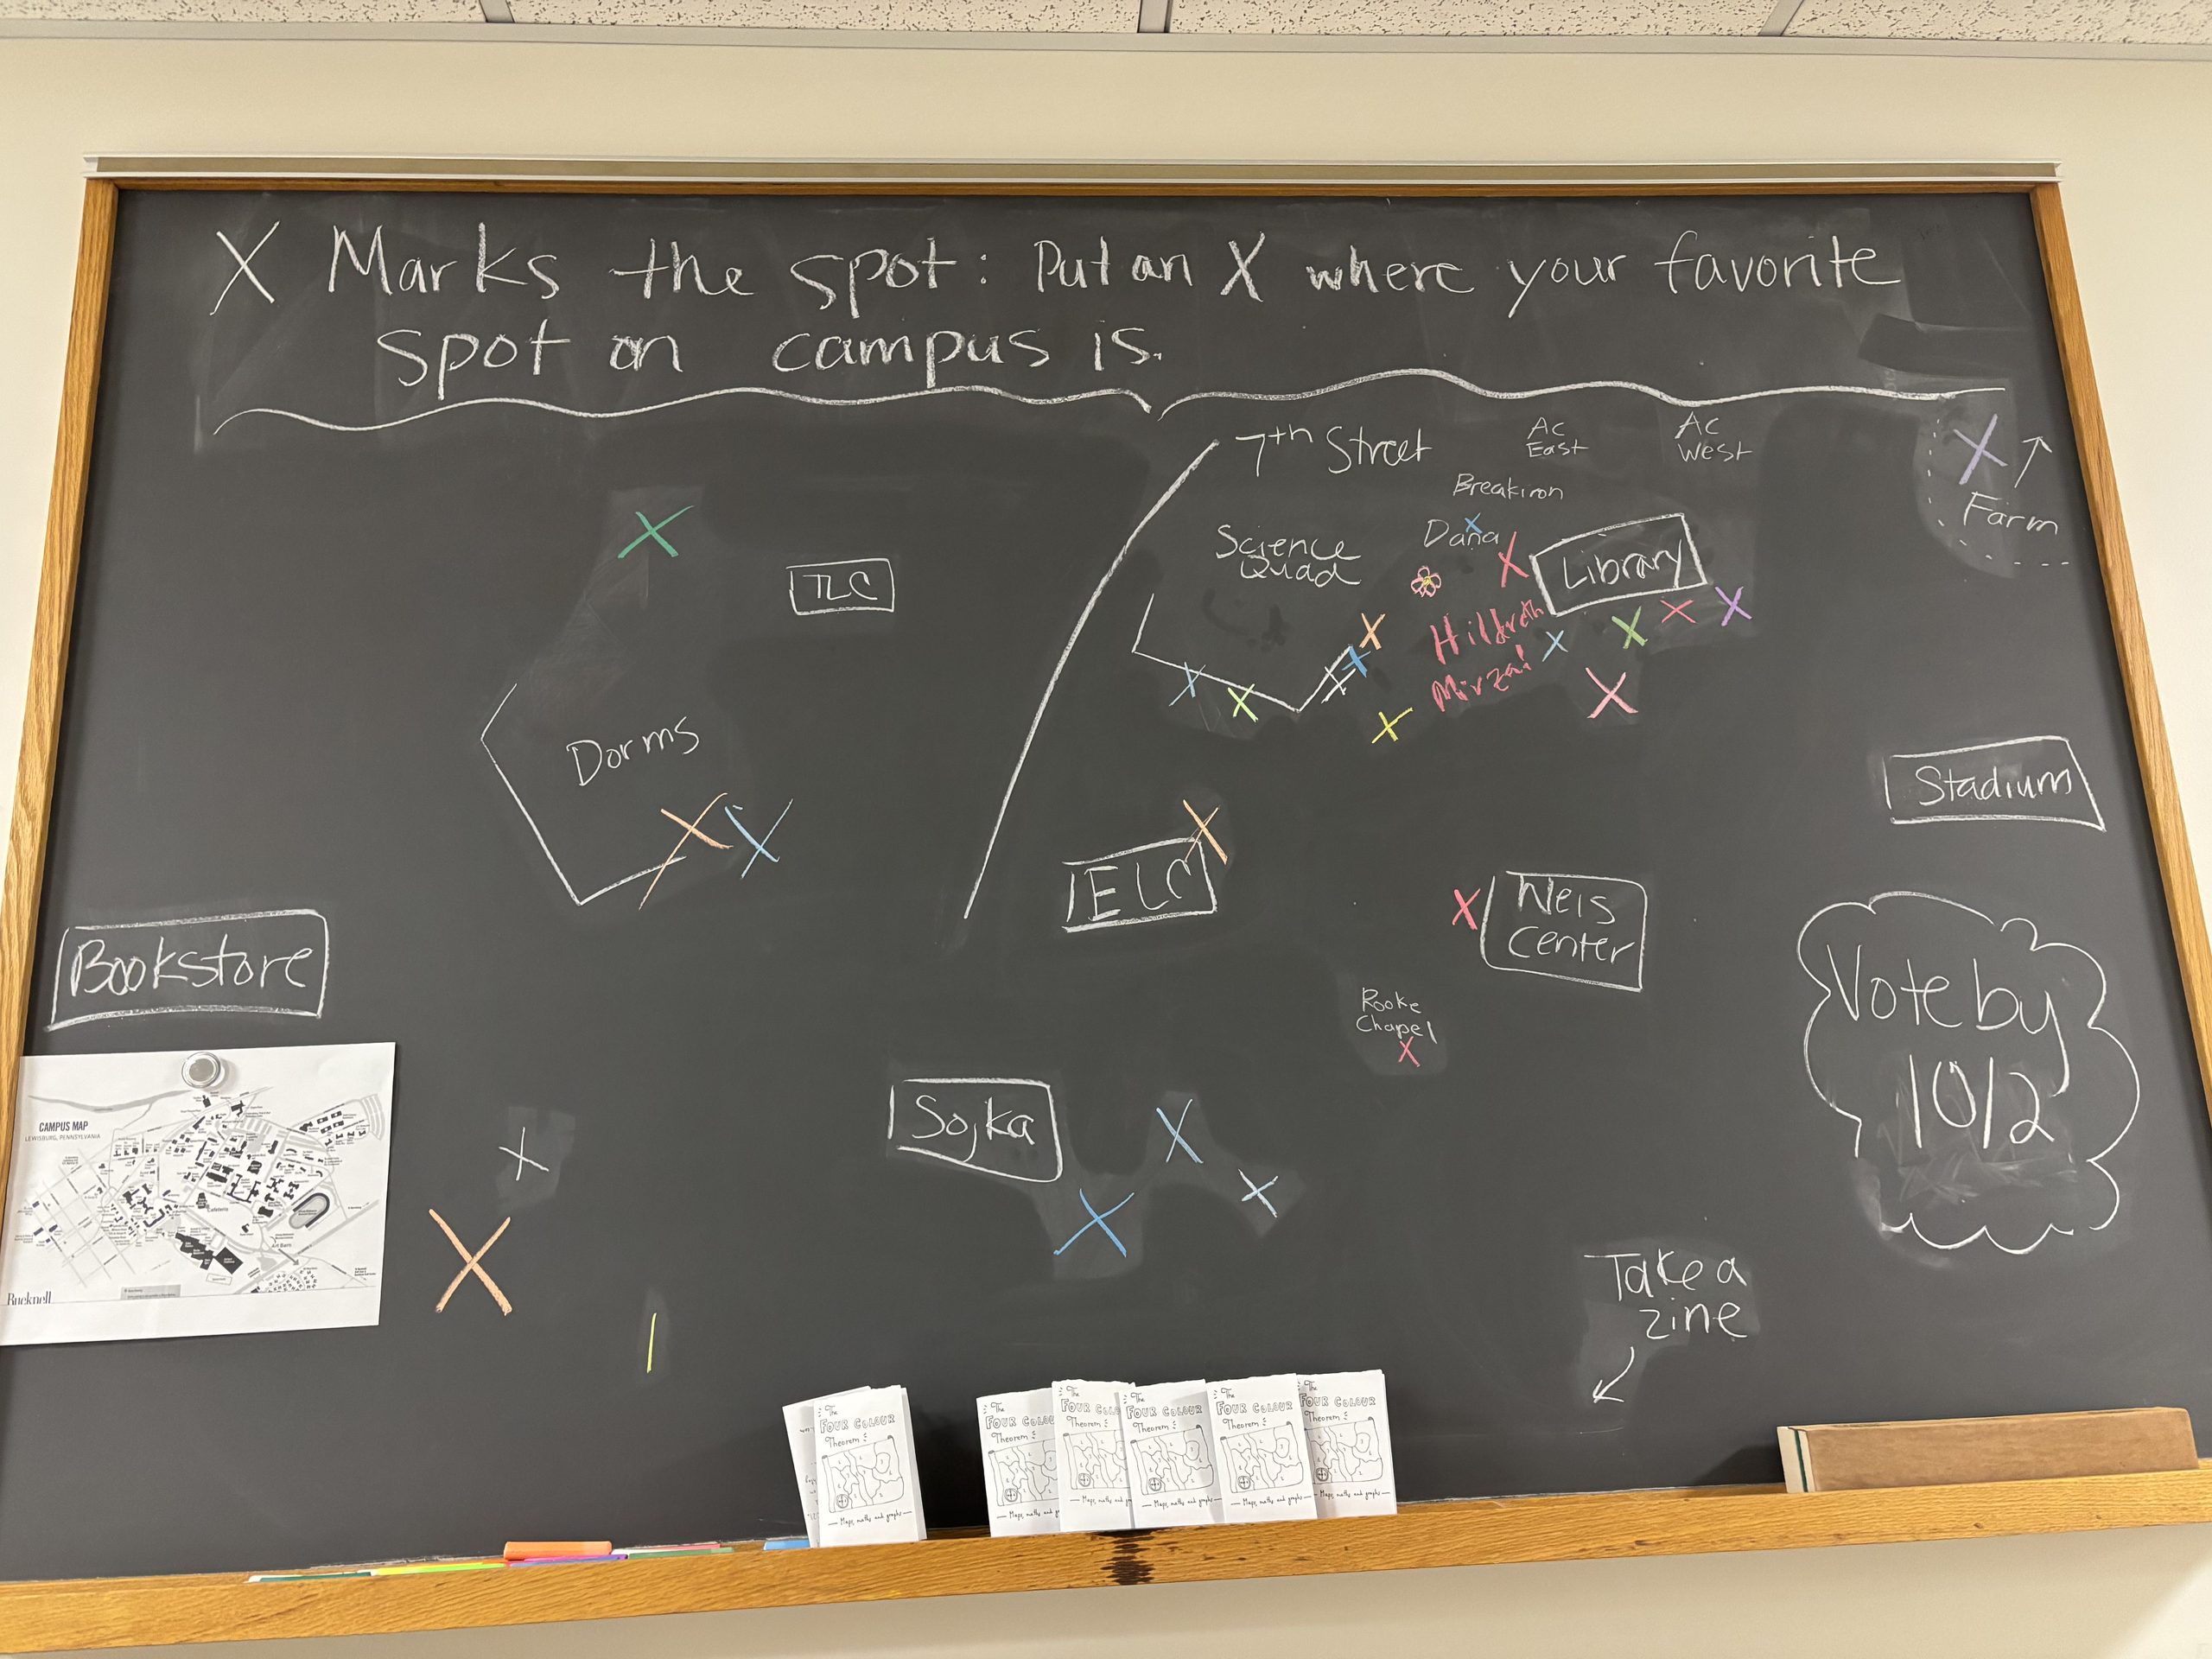
We put our spatial reasoning to the test by trying to map our favorite spots on campus. Again, we felt this one deserved the special colored chalk. Print and fold your own four color theorem zine.

A rough map of the Bucknell campus with Xs where people's favorite spots on campus are.

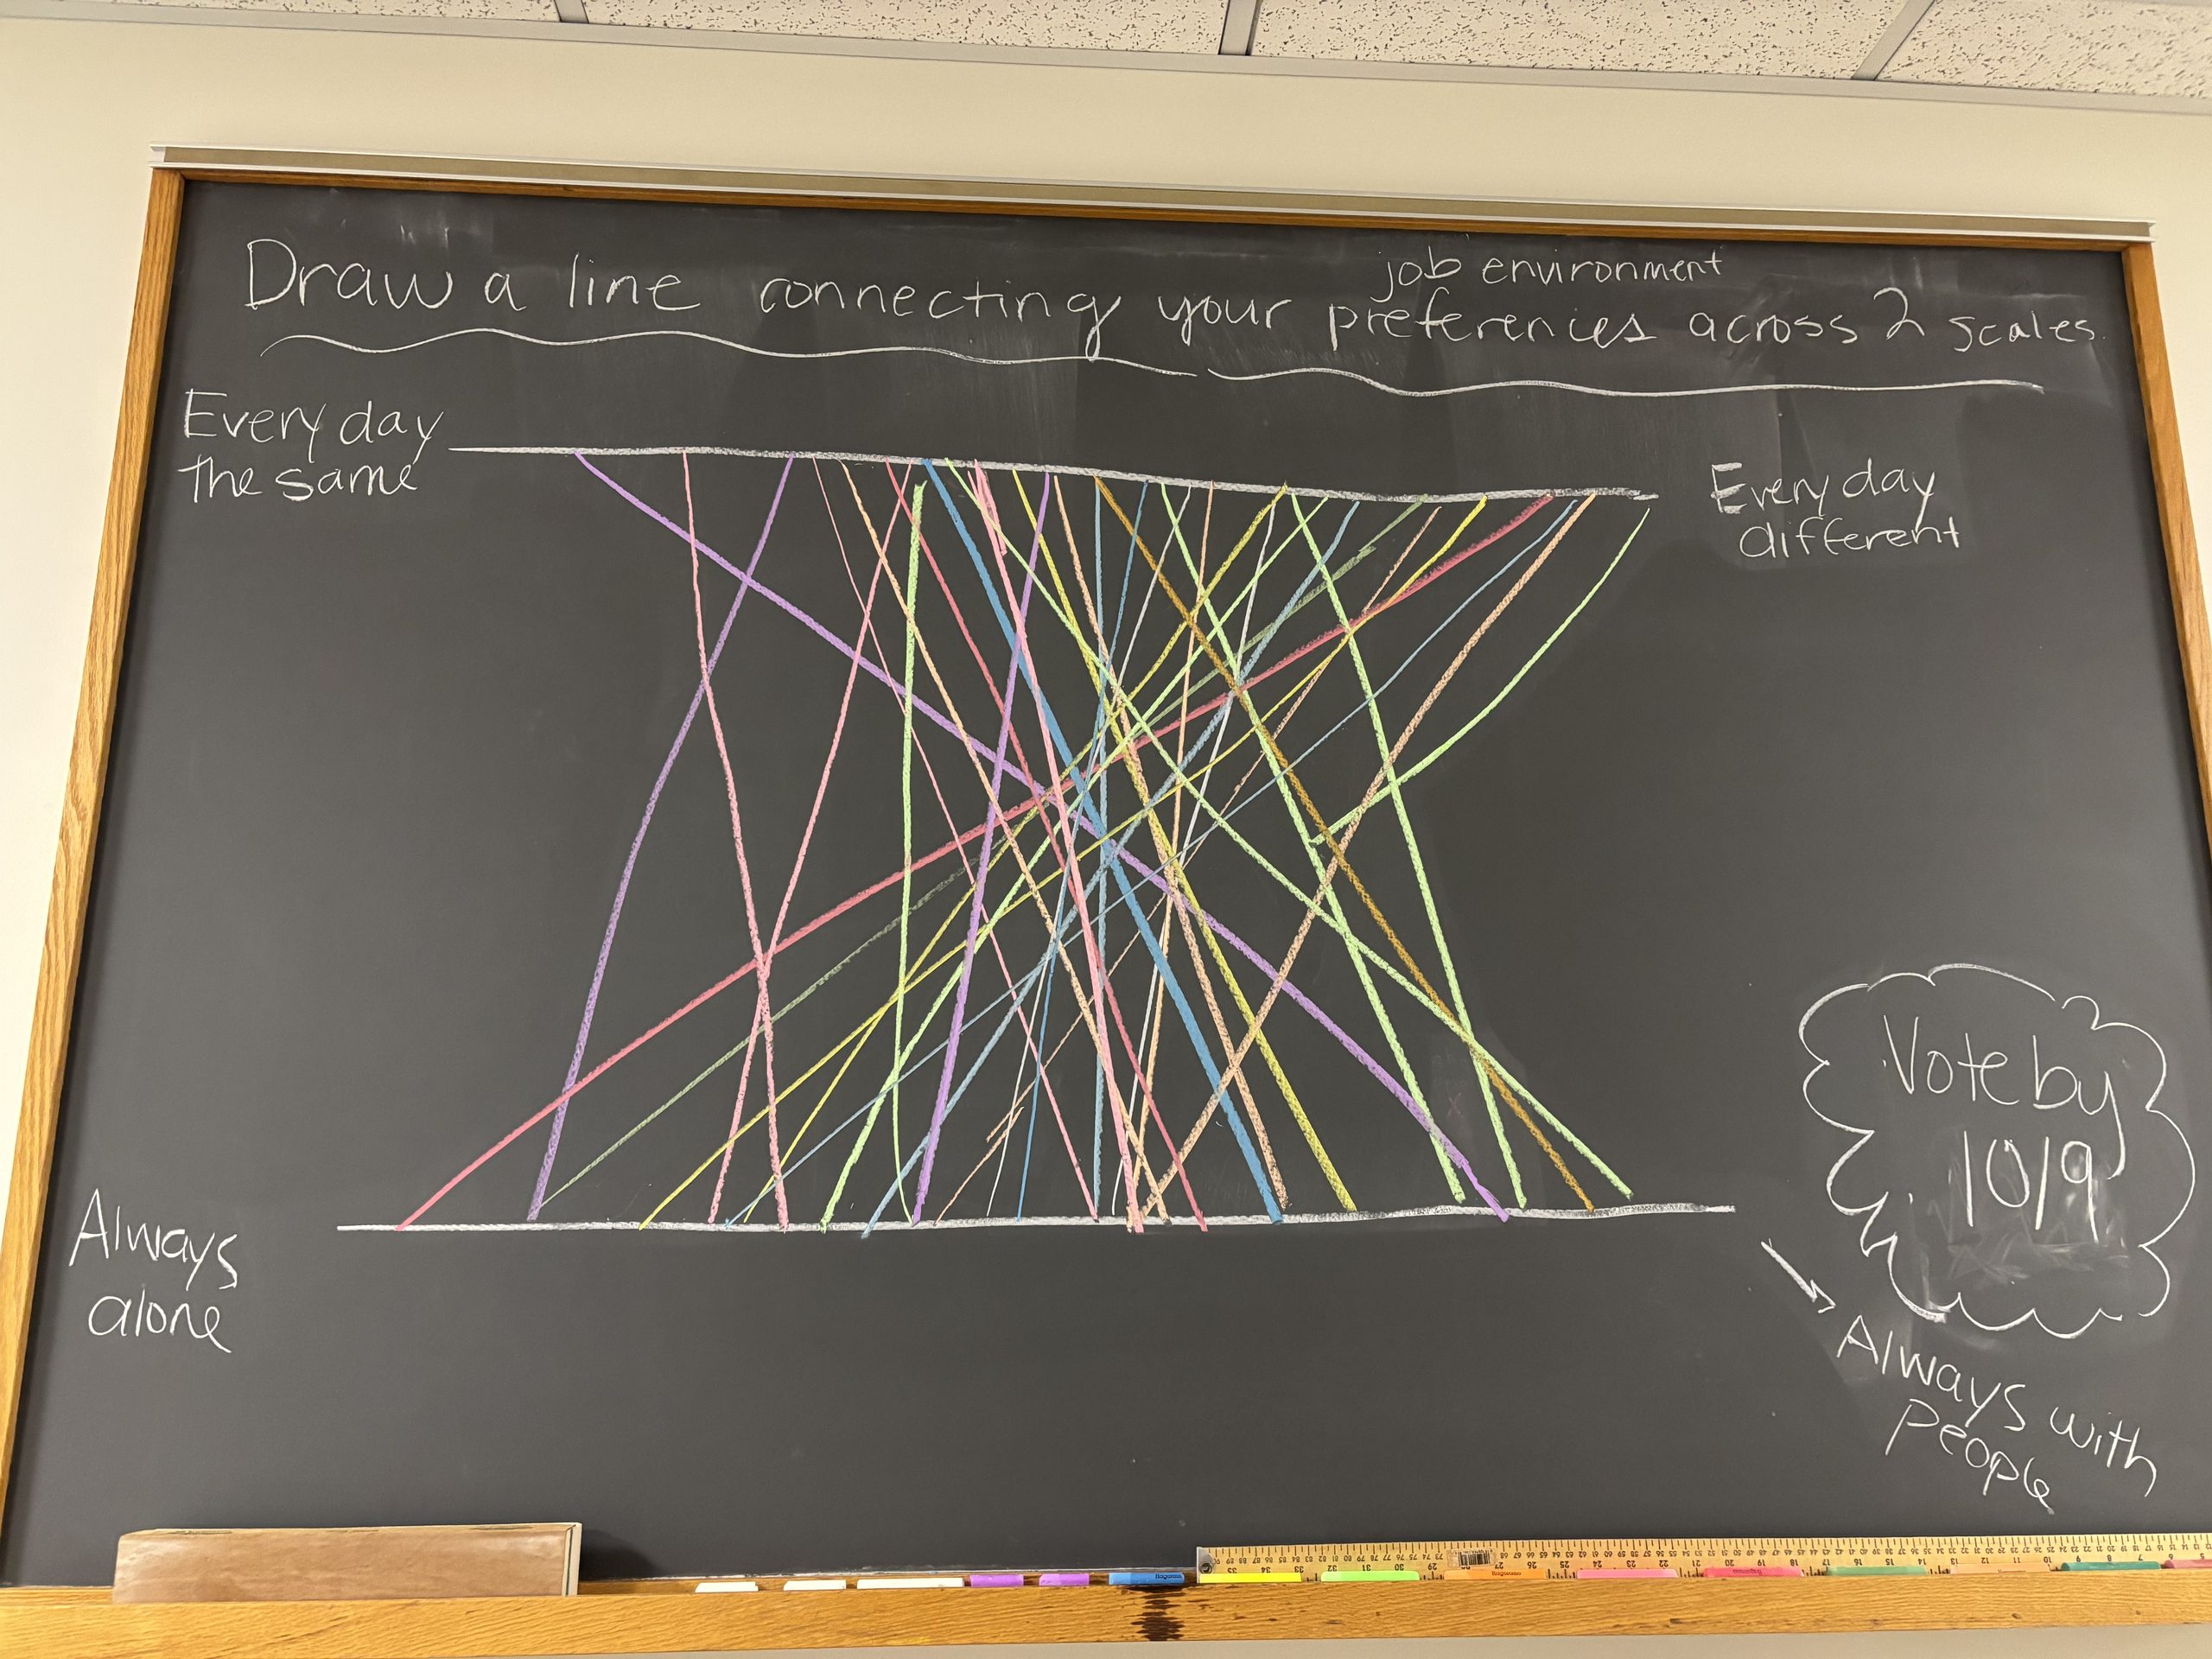
Ahead of Fall Break we considered what makes an ideal job environment in terms of how much variation there is in the day-to-day work and how much time we spend alone v. with other people. We have people with preferences all across the two spectrums. And yes, the colored chalk helps really paint the picture. 😀

Two horizontal axes with one going from every day the same to every day different and the other going from always alone to always with people. Colored lines plot people's preferences for their job environment across 2 scales. The lines span most of the spectrum.

Stay tuned for more chalkboard discussions after a much needed Fall Break!

Want a chance to be featured in a future blog post? Respond to our question of the week here, and your answer may be chosen for a future post.

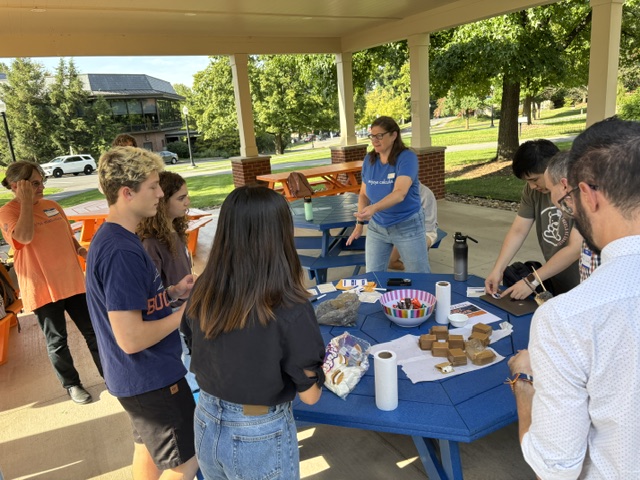
Want S’more Mathematics *and* Economics?

The Mathematical Economics (MECO) major lets students interested in both mathematics and economics have the best of both worlds. They get to pick a track (theoretical, computational, or statistical) to tailor their courses toward their interests.

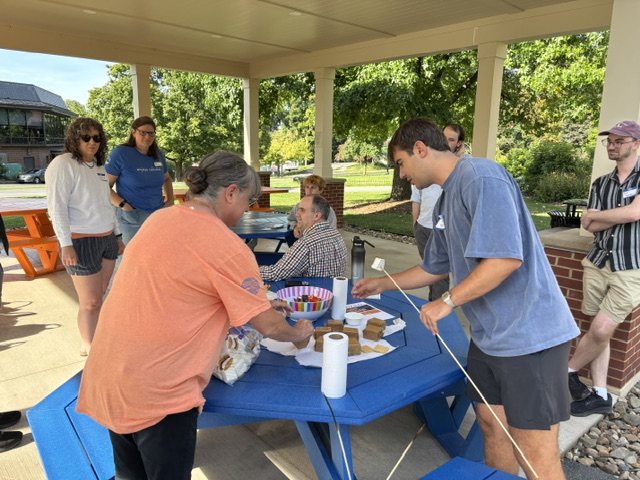
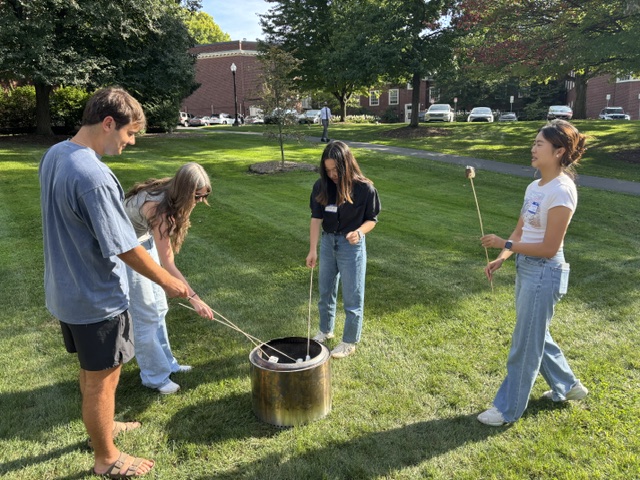
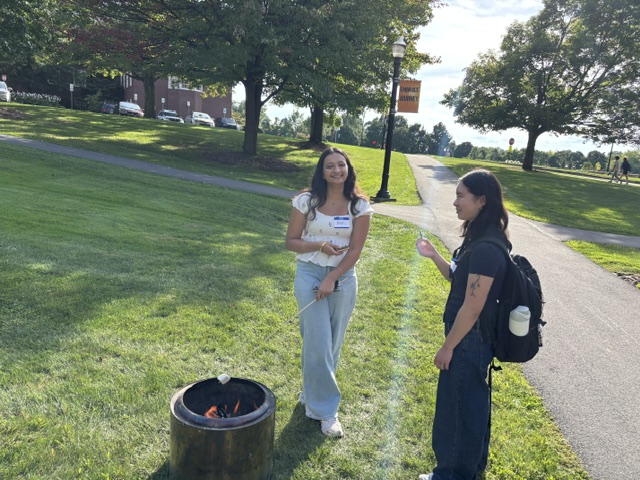
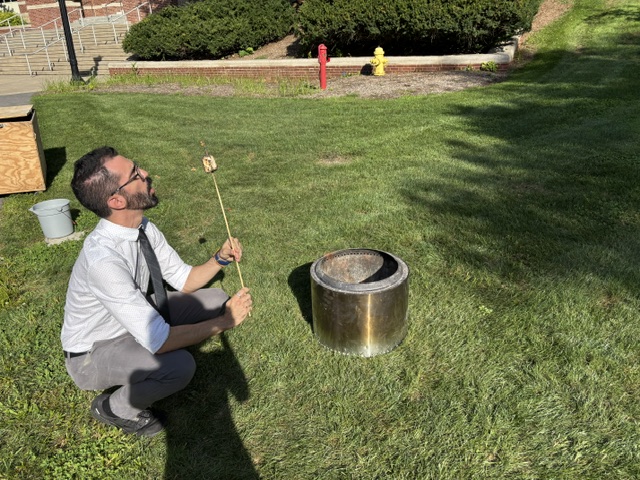
MECO majors across multiple class years joined faculty members in Mathematics and Statistics and Economics to roast some marshmallows, make some s’mores, and form connections across class years.

Follow bucknell.math.stat on Instagram!

John Occhipinti (’27, Mathematical Economics Major), Finley Wardrip (’30, Mathematical Economics Major), Emily Koplin (’30, Mathematical Economics Major), Zoey Zheng (’27, Mathematical Economics Major), Yunke (Wink) Wu (’27, Mathematics major) craft their s’mores.

John Occhipinti (’27, Mathematical Economics Major), Giacinta Robinson (’30, Mathematical Economics Major), Zoey Zheng (’27, Mathematical Economics Major), Sophie Yang (’27, Mathematical Economics Major), Kirandeep Dhillon (’28, Mathematical Economics Major), and Nicole Qian (’28, Computer Science and Mathematical Economics Major) roast marshmallows.

Connect to Department of Mathematics and Statistics at Bucknell University on LinkedIn.

Are you a MECO alum? Reach out on LinkedIn to tell us about what you are up to. You could feature in a future blog post!

Want a chance to be featured in a future blog post? Respond to our question of the week here, and your answer may be chosen for a future post.