Student Talk Series: Sergi Elizalde, Dartmouth College, November 20th, Olin 268 @ noon

Title: Lattice paths between two boundaries

Abstract: Dyck paths are lattice paths with steps N=(0,1) and E=(0,1) starting
at (0,0), ending at (n,n), and never going below the diagonal y=x.
Among the many interesting facts known about Dyck paths, one is that
the parameters ‘number of E steps at the end’ and ‘number of returns
to the diagonal’ have a symmetric joint distribution, meaning that to
each Dyck path we can bijectively associate another one where these
parameters are interchanged.

I will show that this symmetry property applies not only to Dyck
paths, but more generally to lattice paths with N and E steps that lie
between any two fixed boundaries. Finally, I will discuss how these
lattice paths are related to other objects in combinatorics, such as
matroids, semistandard Young tableaux and k-triangulations.

This is joint work with Martin Rubey.
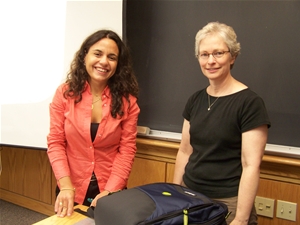
Distinguished Visiting Professor Talk Series: Paola Sztajn, North Carolina State University, November 4, @ 4pm in Olin 372

Title: Learning from systematic descriptions of mathematics professional development

Abstract:  In this talk I present emerging results from a systematic
review of publications on mathematics professional development. The
research team reviewed over 170 papers published between 1992 and 2010
to address the following research questions: What do we know about the
design and conduct of mathematics PD being studied by researchers and
how are these PD characterized in research reports? The conceptual
framework included six elements: theory, context, goals, content,
format, and activities.

Distinguished Visiting Professor Talk Series: Eva A. Gallardo Gutierrez, Universidad Complutense de Madrid, October 23rd @ 4pm in Olin 372

Gallardo2007

Title: Rota’s Universal Operators

Abstract: The Invariant Subspace Problem for Hilbert spaces is a long-standing question and the use of universal operators in the sense of Rota has been one tool for studying the problem. The best known universal operators have been adjoints of analytic Toeplitz operators or unitarily equivalent to them. We present many examples of Toeplitz operators whose adjoints are universal operators and exhibit some of their common properties. Some ways in which the invariant subspaces of these universal operators interact with operators in their commutants are given. Special attention is given to the closed subalgebra, not always the zero algebra, of compact operators in their commutants.


Algebra etc. Seminar: Shelby Kilmer, October 16 @ 4pm in Olin 372

Title: Random Groups at Density 1/2

Abstract: Random groups in the density model (with density 0<d<1) have
presentations with a random set of (2m-1)^{dk} relators of length k on
m generators. The classic theorem in the density model states that for
d>1/2, random groups are asymptotically almost surely trivial or
isomorphic to Z/2Z, while for d<1/2, random groups are asymptotically
almost surely infinite hyperbolic. This summer our research group
studied random groups at d=1/2 and found both infinite hyperbolic
groups and trivial groups are generic, depending on how we tuned
certain parameters.

Algebra etc. Seminar: Nathan Ryan, October 9 @ 4 pm in Olin 372

eca

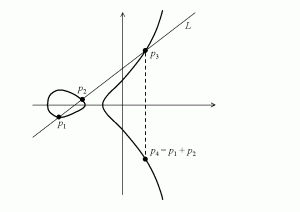
Title:  Elliptic Curves: New Solutions to Old Problems

Abstract:  Elliptic curves are ubiquitous in math and in number theory in particular.  They are studied for their geometric, arithmetic and analytic properties.  We focus on three old problems recently (partially) solved using elliptic curves:  one problem is from cryptography, one is from the art world and one is from high school geometry.

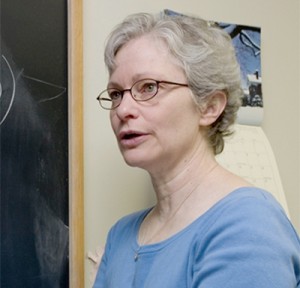
Student Talk Series: Pamela Gorkin, Bucknell University; October 23rd @ noon, Olin 268

Gorkin-main

Title: The World’s Greatest Game

Abstract: Analogy pervades all our thinking, our everyday speech and our trivial conclusions as well as artistic ways of expression and the highest scientific achievements.” This quote, from George Pòlya, is from his book, “How to Solve It”. If you have a problem that you want to solve, this is the book and, possibly, the talk for you. We’ll follow Pòlya’s four-step method as we discuss questions from different areas: probability, geometry and life and, as a plus, we’ll learn to visualize something people often think is imaginary.

Bio: Pamela Gorkin is a Professor in the Mathematics Department here at Bucknell.

Student Talk Series: Allison Gibson, Nielsen Holdings; October 2nd in Olin 268 @ noon

allison-gibson

Title: Twitter’s Influence on TV Ratings, And Other TV Mathematics

Abstract: Nielsen’s TV Ratings are used as the currency with which key business decisions are made across the media industry. What TV programs remain on the air, which advertisements you see during commercial breaks, and when you are able to watch your favorite shows on Hulu are all questions answered by analyzing ratings and other Nielsen data. Recent technology has rapidly changed how and when people watch TV, thus quickly increasing the demand for enhanced data to give TV Networks and Advertisers a thorough understanding of the current TV landscape. Using various forms of TV Mathematics, exciting new conclusions, like whether Twitter influences TV Ratings, can be made.

Bio: Allison Gibson, an Associate Media Analytic Consultant at Nielsen, graduated from Bucknell in May 2013 with a double major in Mathematics and Italian Studies and a minor in Film Studies. While at Bucknell, she was a Tour Guide and Tour Guide Student Coordinator, Co-Founder and Musical Director of The Offbeats A Cappella group, and Vice President of Food (Public Relations) for the Mathematical Association of America. Allison has been working at Nielsen, a Fortune 500 Company known for the Nielsen TV Ratings system, since graduating about a year and a half ago. She started her career as a Research Analyst providing a wide variety of media-related data to many of Nielsen’s TV, Advertiser, and Agency clients. As of August of this year, she is an Associate Media Analytic Consultant working primarily with clients like FOX Networks, AMC Networks, Tech companies (i.e. Amazon, EBay) and the Telecom sector (i.e. Verizon, AT&T).

Distinguished Visiting Professor Talk Series: Nema Dean, University of Glasgow, September 17th @4pm in Olin 372

Image002

Title: Identifying Boundaries in Spatial Modelling for Disease Mapping

Abstract: The aim of disease mapping is to estimate the spatial pattern in disease risk across a set of areal units, in order to identify units which have elevated disease risk. Existing methods use Bayesian hierarchical models with spatially smooth conditional autoregressive priors to estimate disease risk, but these methods cannot identify the geographical extent of spatially contiguous high-risk clusters of areal units. We propose a two stage approach, which first produces a set of potential cluster structures for the data and then chooses the optimal structure by fitting an extension of the Bayesian hierarchical model. The first stage uses a hierarchical agglomerative clustering algorithm, spatially adjusted to account for the neighbourhood structure of the data. This algorithm is applied to data prior to the study period, and produces a set of n potential cluster structures. The second stage fits a Poisson log-linear model to the data, in which the optimal cluster structure and the spatial pattern in disease risk is estimated via a Markov Chain Monte Carlo (MCMC) algorithm. After assessing the methodology with a simulation study, it was applied to a study of respiratory disease risk in Glasgow, Scotland, where a number of high risk clusters were identified.

Distinguished Visiting Professor Talk Series: Nema Dean, University of Glasgow, September 16th @ 4 PM in Olin 372

Image005

Title:  How many groups?  Visual tools for assessing cluster structure in data.

Abstract: Cluster analysis is a set of methods designed to explore and find unknown group structure in (multivariate) data. There are a wide variety of methods available, the application of which can result in many different proposed cluster structures. Particularly for more heuristic methods (e.g. hierarchical clustering), it can be difficult to make an objective decision on which method/number of clusters gives the “best” answer. One alternative that claims to address this flaw is the model-based clustering methodology – the application of, often Gaussian, mixture models usually with some likelihood based criterion for selection of the best model/number of mixture components. An issue with this approach can be its tendency to overestimate the number of groups when associating each mixture component with a cluster (estimated group). This talk seeks to present novel applications of an old fashioned clustering tool – the dendrogram – to visually assess either combination of mixture components into clusters or to assess the similarity/grouping of clustering solutions from a variety of methods (applied to the same data). The dendrogram’s tree diagram presentation is a particularly useful graphic as it can be easily understood by laypeople and is a visually appealing tool for exploratory analysis into group structure. It is also a good summary for data of arbitrary dimension.